
There’s been quite a lot of discussion, in various places, about the increase in Antarctic sea ice extent. I think it’s been increasing at around about 1% per decade. This is still quite a bit slower than the about 3% per decade rate at which Arctic sea ice extent is declining. However, in terms of energetics, this doesn’t tell the whole story as what is important is the amount of sea ice, not the extent.
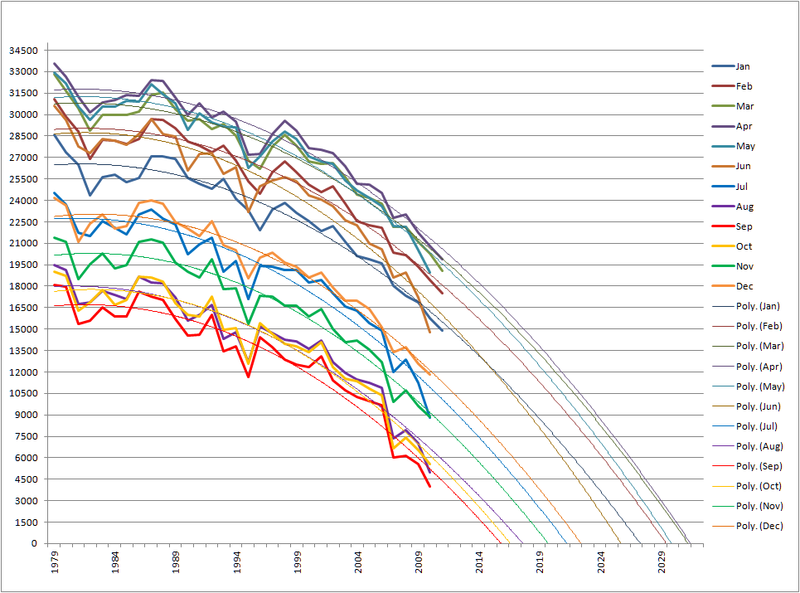
For example, if we consider the figure below (which is PIOMAS data and is from Neven’s sea ice blog) the volume/mass of Arctic sea ice is dropping exponentially. Just the average change since 1979, is 10-20% per decade (unless I’ve done my sums wrong). This is quite remarkable and it would seem unlikely that the thickness of the new Antractic sea ice would be such as to mean that the rate of increase in Antarctic sea ice volume would be even close to the rate of decrease of Arctic sea ice volume.
I had, however, never been able to find any information about the rate at which Antarctic sea ice volume is increasing. Today, however, Oliver Bothe tweeted a link to a recent paper called Modelled trends in Antarctic sea ice volume (by Holland et al.) that seems to be an attempt to determine this. The abstract says
The model suggests that overall Antarctic sea ice volume has increased by approximately 30km3/y (0.4%/y) as an equal result of areal expansion (20×103km2/y, or 0.2%/y) and thickening (1.5mm/y, or 0.2%/y). This ice volume increase is an order of magnitude smaller than the Arctic decrease, and about half the size of the increased freshwater supply from the Antarctic Ice Sheet.
I appreciate that this is the first source that I’ve been able to find that has presented evidence for the rate of increase of Antarctic sea ice volume, so one should be careful about making too much of a single study. However, it does seem to be suggesting, quite strongly, that the rate of increase of Antarctic sea ice volume is about an order of magnitude smaller than the rate of decrease of Arctic sea ice volume. I don’t know about the rest of you, but in my world that means one is quite a bit faster than the other.

ATTP,
You quote the volume change as being indicative of “energetics”, hence justify using this as the best measure of the relative significance of the two areas of sea ice.
I doubted whether the total energy absorbed is actually all that significant – I think energy from ice loss is pretty small at a global level.
I had a quick go, using:
Total volume loss 2002-2012 = 7000 km3 (eyeballing PIOMAS, 2002 min = 11, 2012 min = 4)
Heat of fusion 334kj/kg
Arctic ocean area = 14 million km2
This works out at an average energy absorbed of ca 0.5W/m2 in melting the arctic in sea ice alone by my sums (health warning – could easily be a mistake in my arithmetic )
Which compares to a global average energy accumulation of also coincidentally 0.5W/m2 (source: SKS widget)
So in the arctic at least, the energy flux absorbed in sea ice melting seems significant. I take it back.
I do doubt that any comparison of the sea ice Arctic to Antarctic is really meaningful, the geographies are so different, so I’m not sure that claiming their relative sizes matters – if Antarctic sea ice were growing 10x faster, we’d not take it as evidence of a lack of warming and likewise if it were declining we’d probably say that supported warming.
It is though fascinating that ice is counterintuitively growing in Antarctica, but this appears to be expected to stop at some point. I wonder if anyone has sufficient confidence in their understanding to predict when? Calling Judith Curry – “ increased loading of greenhouse gases in the atmosphere through the 21st century… …results in a projected decline of the Antarctic sea ice. (h/t http://rabett.blogspot.co.uk/2014/01/curry-vs-curry.html)
VTG,
When I mentioned energetics, I was really just meaning that the growth of Antarctic sea ice would only compensate for the loss of Arctic sea ice if increase in mass in the Antarctic matches the decrease in mass in the Arctic. Of course, that is very simplistic as the geometries are very different and also doesn’t necessarily tell you about the effect on albedo (which would depend on the change in summer extent, more than anything else).
What I thought was interesting in the abstract was how they related the increase in Antarctic sea ice mass to the increase in freshwater from the ice sheets. That’s certainly – I think – one of the arguments for the increased Antarctic sea ice.
VTG, I just tried your calculation. I get that the total amount of energy absorbed since 2002 is about 2.3 x 10²¹J, which is then about 2 x 10²⁰J per year. If you look at the typical “where is global energy going” diagram, this seems about right. About 1% of the energy excess is going into melting Arctic ice.
VTG, I suspect your calculation is also right in that the area of the Arctic is about 2.7% of the total surface area of the planet.
Well, looks like I can still do simple sums 🙂
I was surprised the latent heat was so significant.
But the more important point I think is that any comparison of Arctic/Antarctic sea ice relative decline/increase isn’t really relevant to the case for or against global warming.
Even if the Antarctic were increasing by more than the Arctic were decreasing, we’d still support the overall model of global warming, so long as there was a plausible physical mechanism (eg these http://www.skepticalscience.com/antarctica-gaining-ice-intermediate.htm) for the Antarctic increase.
So I’m sceptical to whether this comparison is a meaningful way to test if the increase is Antarctic sea ice is significant.
VTG, I agree. If I had motivation for writing this post it was mainly to simply point out that the rate at which Antarctic ice mass is increasing is 10 times slower (both in percentage and absolute terms – I think) than the rate at which Arctic sea ice mass is decreasing.
I agree that even if it were comparable, it wouldn’t necessarily imply anything in terms of dis-proving AGW, especially as there are plausible mechanism that are consistent with AGW (increased freshwater flow, for example).
I guess one of the problems with this kind of post is that it can play into “skeptical” hands. Sometimes it’s best to ignore things that aren’t necessarily relevant, than trying to rebut them and give unnecessary credibility.
The “plausible physical mechanism” for increasing Antarctic Sea Ice is just one of many excuses attempting to explain inconvenient facts like the “pause”. What climate science needs to do is divorce itself from the really crazy positive feedback side of AGW, admit that CO2 will cause only a very tiny amount of warming, and admit that the PDO and AMO and ENSO and other cycles explain most of the changes.
No, they probably – almost certainly – don’t. I’m not really that keen on a lengthy discussion about this, but maybe you can explain how an internal cycle can produce more than a century of surface warming, after which we still have a positive energy imbalance and still haven’t reached temperature equilibrium. If you can do that in a physically plausible way, maybe you’ll have a point. On top of that, you’ll also have to explain what’s happened to the increase in anthropogenic radiative forcing of 2-3 Wm-2.
Given that your comment verges on climate science denial and I don’t really want to have to moderate a lengthy and likely unconstructive exchange, I would ask that you think carefully about what you say in your next comment, if you choose to make one.
I’d be cautious about believing Antarctic volume estimates. Its much harder to do cryosat-like radar altimetry in the Antarctic (the ice is more open, and if I’m recalling correctly the signal needs to be off nearly-all-ice cos even a bit of open water confuses it). There are far fewer sub-sfc “truth” measurements (ULS moorings, subs, whatever) and far fewer sfc-truth corings. See-also http://mustelid.blogspot.co.uk/2005/05/sea-ice-what-i-do-in-my-spare-time.html
William, I know very little about it, but I wouldn’t be surprised if it was harder than in the Arctic. I think my post was suitably qualified – at least, I hope so. However, I’d assumed that most of the Antarctic sea ice was relatively thin and so it would seem surprising that the roughly 1-2% per decade increase in extent could produce a much more significant increase in volume.
I would suggest that any comment that reflects a determine a motivations – without evidence that is directly informative about motivations, as our friend sunshine just did, is not serious enough to merit a response. That is, except a response that points out how unscientific is the analytical process employed by our friend sunshine.
It is clear that sunshine has his/her mind made up, and is not respectful of uncertainty as one might expect of a skeptic (in contrast to what one might expect of a “skeptic”).
Anders –
Just a thought….
Rather than get yourself in a situation that is likely to lead down the road to moderation hell/purgatory, with accompanying wails about “censorship,” I would humbly suggest that you not bother engaging with sunshine in a discussion about the science until he/she shows willingness to approach the discussion in a scientific manner.
Joshua, yes, that was the motivation behind the final paragraph on my response. I did wonder if a discussion about forced versus unforced variability, atmospheric heat content, ocean heat content, anthropogenic forcings and feedbacks, etc…., might just scare them away though 🙂
Sunshine, [Mod: snipped because it violates moderation policy] Can you answer the following questions?
1 What happens to the melting point of sea water as it freshens? Does it get lower or higher?
2 Is the ice on the Antarctic continent fresh or salty?
3 Is it melting?
4 Which will tend to float on the top of the other, fresh or salty water?
If you answer all of these questions correctly you will understand one of the “plausible mechanisms” for increase in Antarctic sea ice extent. You will also understand that this mechanism is not only plausible but is actually one of the mechanisms causing the increase.
He/she will not be scared away. He/she is a committed climate warrior.
My opinion is that the best tactic is to let the comments stand, and if you feel inclined to respond, focus on the very basic unscientific-ness of sunshine’s reasoning. Until he/she acknowledges his/her fundamentally flawed determination of causality, he/she will not have demonstrated the intent to engage in a scientific discussion. Isn’t an scientifically valid approach to causality a basic building block of scientific discussion? I have little doubt that sunshine understands the importance of how to approach causality. So, then, why would he/she start his/her foray into the discussion by violating the most basic of scientific principles?
Ian –
Last comment on this:
You are wasting your time. I would say that if you ignore the scientific red flag that sunshine unfurled in his/her very first sentence, then you will not find any common ground for discussing the answers to your questions. You will, basically, play out a ritual that you have no doubt played out countless times.
If you do continue, I will offer that it will be illogical for you to assign responsibility for a fruitless engagement on anything that sunshine does or does not do from this point forward. Let sunshine first demonstrate some accountability for violating the most basic principles of scientific discussion before attempting to engage him/her in a technical discussion. Why would you do otherwise? What would the point be?
Tamino had a great post the other day discussing the difference between skeptics and deniers. It applies to sunshinehours1 perfectly.
To deniers, the ‘pause’, Antarctic sea ice gain, and really everything else they read about climate change is proof that global warming isn’t anthropogenic and/or is nothing to worry about. A real skeptic would be interested in figuring out what science can tell us about these changes, i.e. is the ‘pause’ a real pause (no), what’s causing the slowdown, what does it tell us about the future, etc.
A denier has a pre-determined conclusion (AGW is a hoax, or whatever), and once he finds evidence that he can make support that conclusion, he stops thinking. Then when real skeptics actually continue advancing our scientific understanding (i.e. Antartic sea ice changes are much smaller than Arctic sea ice changes, caused by ‘x’, ‘y’, and ‘z’, and totally consistent with AGW), the deniers flip out and accuse the real skeptics of trying to manipulate data to support their desired conclusion. Which in fact is exactly what the deniers are doing (classic psychological projection).
Joshua, I get a bit upset when people like you criticize what I post. It is my time to waste, if that is how you see it. My questions were for other people who may be reading this post and wondering why the Antarctic sea ice is increasing.
I have discussed things with deniers for almost 10 years. I only wish that climate scientists had been more active in discussing in the media and in blogs back then. It is people like you who seem to not want to show how non scientific deniers are.
I’m doing my best to ignore the more egregious comments these days. It’s hard, and I will slip occasionally, but I’m doing my best.
😉
Ian –
Absolutely. It is your time to waste. And, I suppose, it is (apparently) my time to waste if I offer an observation to you about how you are wasting your time.
Well – that’s kind of amusing since I just wrote a couple of posts discussing how fundamentally unscientific was sunshine’s very first sentence and overall approach to science.
It isn’t logical that your questioning basic attributes of sunshine’s knowledge would inform others about trends in Antarctic sea ice. Further, in doing so you suggest precisely the same basic problem to approach science as that suggested by sunshine’s first sentence. I can’t make specific reference there, but you know what you wrote. You asked a rhetorical question in support of a conclusion for which you actually don’t have evidence. That’s the sort of thing that “skeptics” do.
Not only does that type of interaction not help me to understand Antarctic sea ice, it also causes me to lose confidence in your approach to analysis in the same way that sunshine’s comment caused me to lose confidence in his approach.
As for what it “seems” I don’t want to do – you are absolutely wrong. If that’s what you think it seems I want not to do, then we could have a discussion as to why it seems that way to you. Is it because of poor communication on my part, or mistaken reasoning on your part. But the bottom line is that what you think seems to be the case is, in fact, not the case.
Joshua and Ian,
I’d have a feeling (possibly wrong) that there is a combination of frustration and a misunderstanding about what’s being said. An interesting discussion how best to engage in a scientific discussion and about the merits (or not) of engaging with rather determined “skeptics” would be interesting, but let’s keep it on the right side of constructive of possible.
Anders –
I’m out to do some snowshoeing. I’ll check back later to see if there might be some comments w/r/t a constructive approach.
“Is it because of poor communication on my part,”
Yes
I don’t understand why those of us who criticize deniers get flack from you “softies”.
It will not work if you pussy foot around them, long ago they “framed” the discussion and there was very little push back from those who understood the science behind AGW. They felt that it was no their job to show how dishonest the deniers were. Very few letter to the editor or opinion pieces.
Joshua,
I actually quite like Ian’s approach, provided he remains respectful, because I think there’s some merit to asking questions back of contrarians. I think this would help to avoid a gish gallop and it also helps moderators by requiring the person being questioned to respond to the question before they can introduce something else.
So sunshinehours has a couple of questions they need to answer if they are to comment again. The first is AndThen’s question about “how an internal cycle can produce more than a century of surface warming.”
Thanks Rachel.
Well, here’s the two cents of a random reader from the internet: I found Ian’s approach helpful and informative. It actually prompted some internet searching, which led to a better understanding on my part of the dynamics at play in antarctic sea ice increase. Since I have recently been labeled everything from an alarmist to an anti-intellectual lunatic for suggesting that the impacts of climate change on civilization could easily rival those of a global nuclear war, it would not be accurate to say I am in the “denier” camp. But nevertheless I could see someone on the fence going out and doing a little research themselves, and seeing that Ian’s point of view is correct, while sunshine’s is not. So I for one like Ian’s approach.
Sunshinehours1’s comment is a perfect example of off-topic trolling. I’m surprised that it wasn’t deleted. The fact that he/she did not stick around to engage in a discussion is proof positive.
Ian Forrester – there are pronounced regional differences in sea ice growth. I do not dispute your mechanism at all. How do you account for the regional differences?
Rachel – they’re possibly going to claim things like ENSO reconstructions showing prolonged periods of either El Nino or La Nina dominance.
Rachel (and nnoxks) –
I’m not sure exactly how to respond to your comments in a constructive manner. Let me try. If the comment gets moderated out – I will completely understand.
I am not sure I can say exactly what Ian’s approach is with some uniform characterization. If I did so above, or suggested that I could, then I was wrong to do so.
I think that the part of Ian’s initial response that Anders or you moderated out (not sure if you saw it), however, is not part of a productive approach. All it does is lead to same ol’ same ol’, of the sort we’ve read hundreds of times, IMO. Further, I think that Ian’s follow-on comments reflect a basic misconception of the communicative dynamic that is taking place. I don’t think that an approach based on a misconception is likely to prove optimal. I recognize that there are no optimal approaches, but I think that some are more suboptimal than others.
Specifically: I am not criticizing those who criticize “skeptics,” (as Ian asserted) but criticizing a particular manner of criticism. Ian has a fundamental misunderstanding there. I am not suggesting “pussy-footing” around. Again, a misconception.
I think that Ian’s concept of who has “framed” the discussion, and how, is likewise flawed. The discussion has not been differentially “framed’ by one side or the other, IMO, but each side is fully convinced that it has been “framed” by the other side. IMO, the discussion has been “framed” by the fundamental complexity of the issues being discussed, the fundamental characteristics of how people approach risk (as Anders discussed in a recent post), basic attributes of human cognition and psychology, and very influential phenomena like short-term weather and the economy. Failing to fully recognize the impact of those factors, I believe, is counterproductive.
I think that what Ian indicated about the rationale for his approach shows some fundamentally flawed reasoning. He thinks that writing blog comments that contain the kinds of material that got moderated out will somehow change how the debate is “frame.” Well, I think he is probably wrong. I would be open to evidence, however, as to why Ian thinks those kinds of comments will have any significant effect. I don’t think that there is an such evidence that is, in any way, compelling. In fact, I think that there is quite a bit of evidence that supports a very different views.
As for the rest of Ian’s response to sunshine (after the initial part), which provided actual information – I think that information is useful. It would be interesting for me to see a reasonable discussion related to the information in the rest of Ian’s comment. That won’t ever happen with sunshine.
So I think that the evidence is stacked against the kind of approach reflected in the initial part of his response to sunshine being in any way beneficial. Further, I think that Ian has a very wrong perception of what my perspective is – and that he expressed an absolute certainty in his assessment of my perspective that is not appropriate. Such reasoning, IMO, is part of the problem no matter on which side of the debate it is found.
Joshua,
It was me who removed the first part of Ian’s sentence. I agree that sentences like the one I removed are not productive which is why I removed it. But the rest of Ian’s comment is good and I think you agree, unless I have misunderstood you.
This is consistent with Manabe et al. 1991 page 811: “… sea surface temperature hardly changes and sea ice slightly increases near the Antarctic Continent in response to the increase of atmospheric carbon dioxide.”
For some reason most modern models don’t seem to agree. Manabe et al. attributed the slight Antarctic sea ice increase to increased precipitation in the area. This freshens the frigid surface water and reduces mixing with the warmer water below. Other possibilities include stronger winds which spread out the ice and expose more surface water to be frozen.
As JCH said, Antarctic sea ice trends have significant regional differences. Compare his sea ice trend map to my land ice mass loss trend estimate map from GRACE (Google Earth overlays here).
According to GRACE, Pine Island Glacier is losing land ice faster than anywhere else in Antarctica, but the sea ice in its vicinity is actually shrinking, not expanding. Also, Swart and Fyfe 2013 concluded that “accounting for ice sheet derived freshwater forcing has little influence.”
Fig. 2 and Fig. 4(e) of Parkinson and Cavalieri 2012 (PDF) confirm that Antarctic sea ice extent (not just concentration) is decreasing near Pine Island Glacier.
Here’s Fig.4 from the Parkinson and Cavalieri 2012 paper which DumbSci links to above.
I’ve read most of the explanations for the growth in Antarctic sea ice extent. Judith Curry says some explanations are competing. When I read her comment I started thinking back upon it as when I read them I never saw them as being competing. She’s probably right, but so far I cannot figure out which ones she’s talking about. Are there competing theories?
My personal favorite is wind-pattern theory, which I think fits the regional differences.
Stronger winds, precipitation and meltwater flux are probably all contributing mechanisms, but they can all co-exist so competing seems overly dramatic. The slight Antarctic sea ice extent increase might also be due to unforced natural variation, as Polvani and Smith 2013 point out.
Rachel –
I agree. It would be nice to see someone discuss his points. It would be nice if “skeptics” could engage him in good faith discussion w/r/t the rest of his post. Where’s Barry when you need him?
In my view the sunshine comment serves a useful purpose in that it shows what people are willing to believe as it suits them, and I’m happy to see it not being moderated out (although I can see how certain people who complain about moderation might complain even more so about this not being moderated, given the impression it leaves). Anders’ question was sufficient answer to it and any further direct response risks it becoming the focus of the thread. Ian Forrester’s questions are good and relevant ones, but, in my view, would be better asked as general questions rather than directed to sunshinehours1.
I’m hoping not to have another comment thread devoted to moderation issues. I understand that people have different views about what should be done. I think I also have a fairly good idea of what everyone’s views are. I don’t have any issue with unshine’s comment. It was reasonably civil and easily rebutted. My issue would be if a thread was derailed by someone pushing those views. Being allowed to express them, however, is not – in my view – an issue. As I tried to point out in this post, if I wanted this site to simply be a climate science resource, I could simply stop and let them go to other sites that already exist and are better.
So, somewhat radically, back to the topic of the post…
I notice no-one’s been bold enough to offer their opinion on when the expected decline of Antarctic ice will start – see top post above. I believe (although happy to be proved wrong) that current GCMs project this should be happening already under today’s CO2 concentration.
I’ll offer a definition:
When will annual Antarctic maximum ice extent peak, defined by the NSIDC satellite extent taken as a centred 10 year moving average?
Any takers? Anders?
http://nsidc.org/data/seaice_index/
Also, DumbSci thank you for the links and insights, very interesting.
So exaggerating the significance of Antarctic sea ice growth in order to manufacture uncertainty about the reality of AGW is diagnostic of pseudoscepticsm.
The scientifically interesting discussions seem to be closing in on increased zonal windspeeds, eg Holland & Kwok (2012) Wind-driven trends in Antarctic sea-ice drift which is paywalled, but there’s a press release here.
See also Zhang (2013) Modeling the impact of wind intensification on Antarctic sea ice volume.
VTG,
Sometime this decade?
BBD,
It certainly seems like a manufactured issue, a bit like the emphasis on a “pause”.
VTG
Shindell & Schmidt (2004) write:
So within the next four decades?
ATTP says
Me too!
😉
There is nothing obvious about Arctic ice loss. It was not predicted by the models. Just as Antarctic ice wasn’t.
Arctic ice loss was under-predicted by the models, Shub. Antarctic sea ice growth *was* predicted – right back in 1991. Read the comments.
Under- , or -over – doesn’t matter. The perspectival distortion of the ‘worse than we thought’ has to be overcome here. If a model or prediction fails in a certain direction, the consequences of the failure in representing a failure of our understanding of the system are ignored and the supposed implications of transpired reality are instead highlighted (polar bears will die blah etc) . This should not be the case. We should first go “oh crap, we didn’t get it right”
Arctic ice loss and Antarctic ice gain were both under-predicted.
Moreover, fishing around in old literature will provide support for almost *any* position, so it should not be taken seriously. In the AR4 models, Antarctic sea ice was predicted to decrease. I don’t think the latest GCM outputs were any different.
Cobblers. Reference this assertion to the published literature.
That is what the modelling community *does* for a day job. Endless argument from (false) assertion is tedious and a waste of time, so please don’t indulge in it any further.
Cobblers? … I don’t understand.
Here’s a graph showing failure of the climate models to predict reduction in minimum ice (http://neven1.typepad.com/.a/6a0133f03a1e37970b017744cf5360970d-pi)
This should prompt a “the models do not include factors present in the real world leading to sea ice decrease”.
It does. You argue that it doesn’t, which is cobblers.
Models also fail to reproduce hot mid-Pliocene climates. That’s not a shred of comfort either. Thankfully, we aren’t reliant on models as the sole or even main source of our information. Paleoclimate behaviour provides that. So we know to expect substantial Arctic amplification of warming as a consequence of positive feedbacks not yet modelled in sufficient fidelity.
“It does. You argue that it doesn’t, which is cobblers.”
I do? Clearly, from the above, I support the notion that there may be factors other than CO2 melting the Arctic ice at the end of summer in the northern hemisphere
BBD,
Shindell & Schmidt (2004)
“While most of the Earth warmed rapidly during recent decades, surface temperatures decreased significantly over most of Antarctica”
Steig et al (2009)
“A new reconstruction of Antarctic surface temperature trends for 1957–2006… …suggests that overall the continent is warming by about 0.1 °C per decade”
http://www.nature.com/nature/journal/v457/n7228/covers/ see also http://www.realclimate.org/index.php/archives/2012/12/the-heat-is-on-in-west-antarctica/
Seems that latest view is that Antarctica is actually heating rather than cooling?
If Shindell and Schmidt were correct, would a cooling continent be consistent with what GRACE is showing for mass loss?
Shub,
I (and I think everyone here also) agree that departures of modelled results from measurement are interesting and important and should be investigated. Are you suggesting this is not happening?
ATTP/BBD,
I guess your predictions differing by a few decades nicely illustrates the consensus position in AR5:
” There is low confidence in the scientific understanding of the observed increase in Antarctic sea ice extent since 1979″
tall guy
It is evident there are factors in the climate system leading to summer ice extent decrease in the Arctic that are not present in the models. Similarly, it is evident there are factors in the system causing an Antarctic sea ice increase not present in the models.
There are papers admitting the problem with the Antarctic sea ice.(For instance, Turner et al, 2013: An Initial Assessment of Antarctic Sea Ice Extent in the CMIP5 Models. J. Climate, 26, 1473–1484.). I saw several others more. Maybe there are papers doing the same for the Arctic.
With the above, it is not prudent/better word to calculate latent heat energy quantities involving in ice melt. This is mainly because, it appears, the energy is derived from different unaccounted partitions.
Shub
Que?
Shub,
I would argue that it is energy that is melting Arctic sea ice, not specifically CO2. I know you think I’m probably being pedantic, but I think this distinction is actually important and the CO2 – not CO2 argument is largely meaningless.
VTG
Might it be the case that the warming is confined to West Antarctica and S&S04 were discussing the Antarctic land mass as a whole?
ATTP
It is important – especially when someone is trying to construct a strawman out of it.
“I would argue that it is energy that is melting Arctic sea ice, ”
I don’t know about pedantic but it is certainly tautological. The underlying question is always “what’s doing it?” (on which I agree with you), and the current proffered answer is CO2
The current proffered answer – where “it” is melting Arctic summer sea ice – is positive feedbacks to CO2 forcing. You are constructing a strawman.
Shub –
BBD asked you a question:
It’s a good question. Could you answer it?
Shub,
I think that’s a simplistic interpretation of the answer. Greenhouse gases trap outgoing long-wavelength radiation, produce an energy imbalance (more energy coming in than going out), and increase the total amount of energy in the climate system. Over time, the build-up of energy will increase surface temperatures and, eventually, the system will reach temperature equilibrium.
However, precisely how this excess energy is distributed through the climate system is not determined simply by there being increased atmospheric CO2 concentrations. Most goes into the oceans, some heats the land and atmosphere, and some can melt polar ice. Internal variability, however, means that the exact break-down of how this energy is distributed can change with time (hence, one reason for a surface warming slowdown).
Currently, virtually all components of the climate system are gaining energy. Surface warming may have slowed, but it hasn’t stopped and it certainly isn’t showing cooling. Ocean heat content continues to rise. The total amount of ice on the planet (sea, glaciers and ice sheets) continues to decrease [edit – thanks Joshua]. That Arctic sea ice is melting is almost certainly because we have been accruing energy into the climate system (i.e., it’s very hard to see how it could be happening without increased atmospheric CO2). However, it is quite possible that some internal cycle could be transporting more energy to that region and melting the sea ice faster than maybe was the case in the recent decades. It could well slow if this cycle were to reverse.
So, if you want to argue that it’s not CO2 (as you put it) you’ll have to try and argue why when the climate system is accruing energy, the Arctic sea ice just happens to be coincidentally melting via some completely unrelated process. I think that’s a very difficult argument to make.
I assume you meant “decrease.” Keep talking like that and Shub won’t have any reasons to invent straw men.
> there may be factors other than CO2 melting the Arctic ice at the end of summer in the northern hemisphere
May I suggest heat?
> the models do not include factors present in the real world leading to [insert the daily ClimateBall topic here]
Talk about tautological.
ATTP,
I think the word you’re looking for may be consilience, the principle that evidence from independent, unrelated sources can “converge” to strong conclusions.
http://en.wikipedia.org/wiki/Consilience
All models are wrong, but some are wrong.
GCMs are designed to produce long-range forecasts. The fact that they do not produce accurate year-to-year forecasts should surprise no one who has a basic understanding of how models work.
I would like to thank Dumb Scientist, Very Tall Guy, and BBD for their value-added and on-topic contributions to this comment thread. You have provided quality science-based information.
Anders –
Completely off-topic but related to a previous discussion…
No offense taken if you delete the comment – just thought you might be interested.
If you are interested in learning more about what’s going on in Antarctica, you’ll want to check out the current series of posts by Mark Brandon on his website Mallemaroking.
http://mallemaroking.org/
By coincidence, Mark Brandon is also posting about Antarctica sea ice on his Mallemaroking blog. His current post, “The seasonal cycle of Antarctic Sea Ice extent” is instructive.
http://mallemaroking.org/
badgersouth, yes, Mark Brandon’s post is really interesting. I like the video.
Hi ATTP, as the original author of that Arctic Sea Ice graph you grabbed from Neven’s I’d just like to point out a few non-obvious limitations (there are also some obvious ones, but well, they’re obvious).
Firstly, the data used was interpolated from graphs produced by the Polar Science Centre, not from their published data (they didn’t release any at the time I did that); As such its not super accurate.
Secondly, I posted this graph about a week before the PSC released version 2.0 of PIOMAS, which made a difference to the curves (extending those extrapolations by one or more years) and around the same time started making the underlying data available. Three years more data has also changed the curves somewhat. Neven’s current PIOMAS updates are illustrated with Wipneus’ excellent renderings. PSC have recently moved on to version 2.1.
I’m rather chuffed to see this still in circulation, but these days it looks a bit like that millenial-scale temperature reconstruction based on Lamb (1965) that appeared in the FAR. There are much better ones around now.
FrankD, thanks for the comment and the clarification. I quite like the figure because it shows all the months nice and clearly and I haven’t found a recent version (although maybe I haven’t looked hard enough 🙂 ). I guess the updates you’re referring to can be found here. Although it looks at though there is a difference, it doesn’t appear to change the basic conclusion I draw here.
Okay, I think I’ve found a slightly more recent version of the figure. Also, FrankD, am I crediting these appropriately?
Arctic sea ice volume from PIOMASS.
” how an internal cycle can produce more than a century of surface warming”
The same way the Roman Optimum occurred, the Medieval Warm Period and the Minoan Warming all happened.
2-3W/m2 is for a doubling of CO2 which hasn’t happened yet.
“Given that your comment verges on climate science denial …”
Your comment is natural cycle denial and I don’t want to waste my time with someone like you.
sunshinehours1: You imply that the “Roman Optimum”, the “Medieval Warm Period”, and the “Minoan Warming” periods are examples of global climate change. If that is what you mean, please document the sources that are the basis of your understanding.
sunshinehours1
Sunshinehours is somebody else who doesn’t understand that the top of the Greenland Ice Sheet is not a proxy for global average temperature.
Dr Peter Stott, head of the Climate Monitoring and Attribution team at the UK Met Office addresses natural variability quite nicely in his guest post on the Carbon Brief, What climate change attribution can tell us about extreme weather – and the recent UK floods
sunshinehours1:
“Your comment is natural cycle denial and I don’t want to waste my time with someone like you.”
As though anyone here expects you to waste your time discussing science with a physicist … what would a scientist know about science, anyway?
“am I crediting these appropriately”
Sorry for the delay in responding ATTP.
Your link looks like the most recent one. I think it uses PIOMAS* v2.1 – certainly Wipneus was discussing the upgrade to the model at Neven’s Arctic Sea Ice Blog, so I presume he’s used their most recent data. As to appropriate crediting, Wipneus made the sensible choice some time ago of adding his details to forestall any attribution problems. The only thing that seems to trip people up is that the PIOMAS data is from the Polar Science Centre, but the presentation is by Wipneus. PSC have never put out a month-based graph like this AFAIK.
I certainly wasn’t worried about you using my graph uncredited – my only purpose in asserting authorship was to give a basis for my subsequent comments. As I said, I was chuffed to see it being used.
Note – PIOMAS has only one “s”, being an acronym for Panarctic Ice Ocean Modeling and Assimilation System
FrankD,
It may take me a while to correct all the PIOMASSs 🙂
I’d like to comment on the statistic that the Arctic Sea Ice Extent is decreasing by 3% per decade. That all depends on the month that is used for measurements, and the time scale. Sea Ice Extent varies a lot by the month in which it is measured, reaching a maximum in April, and the minimum in September. In these examples, I will use the September Sea Ice Extent. If we fit a straight line to the data from 1979 to 2013, we get the formula that:
September Sea Ice Extent = 7.92 -.0892 (Year-1978).
(in Millions of square kilometers). The R-squared value is .73
So this formula is saying that the best fit straight line shows a decrease in September Sea Ice extent of .089 Million square kilometres per year or .892 Million square kilometers per decade. If we measure that rate compared to the 1978 value (on the best fit line), we get a decrease of .892/7.92 = 11.3% per decade. If we measure that rate compared to the 2003 value (on the best fit line), we get a decrease of .892/5.69 = 15.7% per decade using the last decade as a base (from 2003 to 2013).
A straight line decrease will have a greater % decrease the further forward one goes in time, because the amount of decrease is constant (in this case .892 square Mkm per decade), but the starting point is smaller.
The year that the September sea ice extent would disappear using the straight line is 2067.
Someone mentioned (sorry, I can’t find the post right now) that if we used a starting point after 1979, we’d get a larger decrease in Sea Ice Extent, but one problem with that is picking the starting point so that one is not being biased or “cherry picking” the data. If we split the data into two segments, one for 1979 to a particular year, and the other being all the years after that, and making sure each segment has at least 13 years in it (which is at least 35% of the 34 years for which we have data), we can measure the fit of the least squares line, and pick the dividing year that maximizes the fit for the 2 lines. The best fit appears to be 1979 to 1995, coupled with 1996 to 2013. The equation for September Sea Ice extent for the most recent period is:
September Sea Ice Extent = 6.97 -.167 (Year-1996).
(in Millions of square kilometers).
The above equation has an R squared value of .75, which is slightly better than the best-fit line from 1979 to 2013. If the straight line trend continued, the Sea Ice would disappear in 2038.
There is a decrease of 24% per decade using 1996 to 2006.
The 2003 value on the straight line is 5.806, while the 2013 value is 4.136. This shows a decrease of 28.8% over the last decade, which is about an order of magnitude larger than the 3% per decade figure using January data from 1979 to the present.
As mentioned in other places on the blog, the Sea Ice Volume is telling a much more dramatic story than a decrease of 15.7% per decade or 28.8% over the last decade in the September Sea Ice. The best fit trend curve (a curve fits better than a line for the volume data) has the Sea Ice Volume going to zero around 2017 or 2018.
Caterina,
Yes, I agree that there are many others way to evaluate the trends. The numbers I gave were, I think, for the mean trend when one considers all months, not just the minimum extent. It seems, though, that whatever one does, the rate of decrease of Arctic sea ice for exceeds the rate of increase of Antarctic sea ice.
This breaking news will send shivers through your body:
“Arctic sea ice growth has slowed dramatically in recent weeks, thanks in large part to abnormally warm air and water temperatures. Sea ice now sits at record low levels for mid-February.
“According to the National Snow and Ice Data Center, as of February 18, sea ice covered about 14.36 million square miles in the Arctic. The previous low on this date was 14.37 million square miles in 2006.”
Arctic Sea Ice Sits at Record Low for Mid-February by Brian Kahn, Climate Central, Feb 19, 2014
That’s somewhat poor timing because of course as soon as it was written it promptly shoots up again. Its no longer at record-min, but back to not-very-exciting: http://www.ijis.iarc.uaf.edu/seaice/extent/Sea_Ice_Extent_v2_prev_L.png
What about Antarctic NON-sea ice? When you say “sea ice,” do you mean all the Antarctic ice or just that around the perimeter?
Rex,
I mean just the sea ice, not the land ice.
Pingback: Matt Ridley on fossil fuels | …and Then There's Physics
Pingback: Matt Ridley is wrong again on fossil fuels