
Yet another piece of bad news is that wildfires are on the increase in the USA. I linked to that story in a blog post about extreme severe events and climate. The article was by Deanna Conners by at earthsky.org .
She offers this graphic, along with a claim that 2015 was (as of mid-September) already in the top six wildfire years, along with the reasonable speculation that 2015 may exceed prior years:
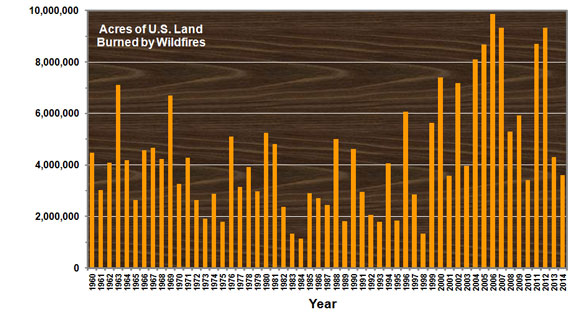
These data trace to “the National Interagency Fire Center in Boise, Idaho, [which] publishes a ton of useful statistics on wildfires that are critical for helping state and federal agencies manage the flames. These records date back to the 1960s.” according to Dr. Conners’ posting.
It’s suggestive of an increase. and compellingly so after adding 2015 to the series as a top-five year.
I also pointed to an odd bit of counter-evidence that I’ve seen trumpeted triumphantly by the occasional climate troll. Unfortunately it is on a legitimate US Forest Service webpage.
 Now everybody who has any intuition about environmental data who has looked at this says it doesn’t pass the smell test – it looks very much as if the pre-1960 data which NIFC does not report is of something else than what NIFC reports after 1960. Unfortunately the sourcing of the graph is unclear.
In a recent comment here, Dr. Conners reports that she has worked on tracking the graph down independently. I think it’s at least important enough to quote in full in a top level article here.
Thanks for linking to my blog on wildfires. I spent some time tracking down the original source for the pre-1960 wildfire data that you linked to in the footnote of your blog—the original source for the U.S. Forest Service graph was “America’s Renewable Resources: Historical Trends and Current Challenges,” which was published in 1991 by the non-profit organization Resources for the Future. The original graph is located on page 117 of Chapter 3, and the author (R. A. Sedjo) cites “U.S. Department of Agriculture, Forest Service, 1926–1967, Forest Fire Statistics, various annual issues,” as their data source. The author also cites “U.S. Department of Agriculture, Forest Service, 1968–1989, Wildfire Statistics, annual issues,” as their data source for post-1960 data. Unfortunately, the text of that document did not describe the data in detail.
I did find a useful supplemental document (http://www.fs.fed.us/research/sustain/docs/national-reports/2003/data/documents/Indicator%2015/Indicator%2015.pdf) to the more recent U.S. Forest Service reports/graphs that had this to say about the pre-1960 data (page 19):
“Between 1930 and 1950, in excess of 10 million acres were burned by wildfires annually. Most of the area burned during this period was in the Southeastern United States (South RPA Region) and were primarily incendiary fires. Since 1960, between 2 and 5 million acres were burned annually by wildfires. In recent years, the average area burned has increased, especially in the Rocky Mountain and Pacific RPA Regions. A peak fire year occurred in 1988 when 7.4 million acres burned. This was the year of the extensive fires in the Greater Yellowstone Basin. The range of recent variation (since 1960), in terms of area burned, was exceeded in 2000 when wildfires burned more than 8.4 million acres. This was the largest area burned in more than 40 years.”
So it appears that much of the pre-1960 data were related to incendiary forest fires (per http://www.interfire.org/features/wildfires.asp, an incendiary fire is one that is set intentionally) and not to true wildfires. The post-1960 dataset that I analyzed only contained data for wildfires; the National Interagency Fire Center explicitly separates the wildfire data from the prescribed fire data. Hence, comparisons to earlier data may indeed be akin to comparing apples to oranges, as Magma cautioned earlier in their comment.
So the case isn’t exactly proven in terms of which are the apples and which the oranges, but it’s pretty compelling that it is a graph, so to speak, of apples after 1960 and some other fruit or fruits before 1960. Fortunately, the title of the graph is honest enough. It says “Total acreage burned – all lands” which pretty clearly indicates that it isn’t really a graph of wildfires.
I think that it does match the 1960-2006 NIFC data closely. If so it must be a plot of at least two separate and distinct records. If that in turn is so, how such a shabby thing gets on a federal website and how to get it off is another story, but examined closely, it neither supports nor refutes the claim that current wildfire extent was greatly exceeded or even precedented in the past.

Looking at the first graph, for wildfires, by eye it would appear that some sort of tipping point occurred around 2000. Does the annual total acreage burnt by wildfire correlate to temperature, precipitation or both (or anything else)? Are there further tipping points in the pipeline? Is there a statistician out there who can perform an appropriate analysis?
Several weeks ago I discussed the dubious nature of the older forest fire statistics, pointed to a contemporaneous source of the compiled data used by the USFS and suggested a few possible reasons for the discrepencies here (third comment from the top):
In any discussion with a motivated rejectionist of the mainstream narrative that climate change is causing more wildfires, you will be told that the cause of the increased wildfires is the stupid Greens trying to prevent the ‘Natural’ fires that always occurred before.
All that 1960s ‘Smokey the Bear’ fire prevention and fire watch towers to prevent and control ANY fires has resulted in an unnaturally low level of fire, which is now causing bigger and worse fires because of the unnatural level of fuel that has built up in the artificially controlled forests.
There is an element of truth in this.
Although the efforts put into fire prevention were as much about protecting a valuable resource. Analysis of fire patterns in the 50s-60s was concerned with the amount of sawtimber or industrial lumber that an area could provide as much as preserving a supposed untouched wilderness.
Indigenous fire-setting as a means of land-management along with a natural rate of fire had shaped the forest ecology before European settlement. The attempt to control and limit forest fires in the 60s~ was partly a misguided attempt to ‘preserve Nature’, but was also a response to a real increase in forest fire rates from agricultural settlement, mining and railroads. The lumber industry also had a role in wanting to protect a commercial crop from the increasing population and industry that was intentionally, and accidentally using fire to remove forests.
As always the reality is complex, contingent and conditional. The ‘Mysterious Wildfire chart’ may represent a real measure of the amount of forest fire in the past. While the peak in the past may be inconvenient for a simple narrative that forest fires are increasing now because of climate change making things hotter and drier, it does represent the POSSIBLE area that could burn in the past. Both as a ‘Natural’ process and increased by the ingress of people and industry. You cannot start large forest fires unless the conditions are conducive to their occurrence. That high peak of incendiary fire was a result of low prevention and control with increased fire sources. It was also during a local climate state that had similar droughts and temperatures to the present.
It may represent the lower range of possible fire rates given the present climate and without the modern prevention and control of fire. Which now includes controlled burning of under canopy fuel load as part of that recent increase. As any keen denialist will tell you.
The answer is the New Deal done it
It’s difficult to discuss wildfires without acknowledging the change in US forests over three centuries. Mature, climax forests are less susceptible to major fire damage and they don’t really exist today. Starting with Colonial settlement and accelerating during Post-Civil War timber “harvesting” (aka, strip-mining), natural tree cover was removed across the eastern United States. By the early 1900s the process made its way to the West Coast — “Georgia-Pacific” was not a randomly generated name.
So along with fire suppression management you must consider that the forests themselves have changed drastically. And we are still learning to deal with it.
As an aside, I toured Yellowstone in the aftermath of the “Great Yellowstone” fires mentioned above. Managers there admitted that suppression techniques over the decades had allowed fuel to accumulate to the point that hotter-than-natural fires sterilized the soil. Even the recovery periods and processes are changed by “modern” forests.
Intensity, frequency and area burned all change when you change the forest itself. Like all of nature, it’s complicated.
A couple more factors in the up tick in acres burned could be attributed to fire management policy. Managing fire for resource benefit and no or limited suppression areas can increase totals. For example, Alaska Fire Service (aka. Bureau of Land Management) has large areas where suppression action is not taken. You can easily have a million acre fire, doing good things, but also bumping up the statistics because it’s a wildfire.
Pingback: 2017: The Year on Fire | The Antiplanner
You’re right and wrong. The graph may be misleading (happily I think the US Forest Service has indeed taken it down), but so is the implication that because the graph mixed both types of fire pre-1960, that the wildfire levels were much lower. Recent trends are no way far more disastrous than has happened before. Look at the hard data from “Report Of The United States On The Criteria And Indicators For The Sustainable Management Of Temperate And Boreal
Forests Of The United States” – a report on the US Forest Service Prepared by: William M. Ciesla
INTECS International Inc. and John Coulston North Carolina State University Raleigh, NC.
Pingback: Climate Change Conspiracy Theorists: Mistaken or Afraid to Face the Facts? – Libby's Climate Change Blog
I have no idea what to make of all this. The forest service took down all the data before 1983, not 1960. IMO a better practice is to leave it up with detailed explanation. There must be a method and source for the data that went into the old yearly totals, correct? Why do people have to guess? If the forest service is up to the level of county ag agents those guys track everything and write it down. It
looks like 9M acres of forest/rangeland prescribed burned in 2019. If you add that to the recent wildfire only totals would that make the old/new comparison fair?
I found these two links in an attempt to get my arms around the prescribed burns.
In 2014 24% were forests and 76% were ag land.Prescribed burns. 11.7 million acres were treated in 2014 with prescribed fire. The results include all federal, state, and private prescribed fire acres for forestry, rangeland, and agricultural burning that occurred in 2014. http://stateforesters.org/sites/default/files/publication-documents/2015%20Prescribed%20Fire%20Use%20Survey%20Report.pdf
https://www.stateforesters.org/newsroom/2020-national-prescribed-fire-use-report/ . According to state forestry agencies, 8,540,401 acres were treated with prescribed fire in 2018. In 2019, 10,003,541 acres were treated. “Additionally, the groups elected to discontinue collecting prescribed fire data for burns performed on agricultural lands”
Click to access 2020-Prescribed-Fire-Use-Report.pdf
I came here just trying to make sense of it all in light of the recent forest service web site change. That link to that goggle table by Magma was great. Good posts. I only have more questions now. No conclusions
https://play.google.com/books/reader?id=FLi4OJU8QYsC&printsec=frontcover&output=reader&hl=en_GB&pg=GBS.PA708
I wonder. Someone told me that he used to ride a dirt bike through the forest as a kid and every other year or so they would burn it and he would come home covered in mud and soot. The mature trees remained he said. I wonder how that counts? I believe he lived in the SE US.
Someone in CA said that there is a big difference between the forest fires and the scrub fires that burn Malibu movie star homes.
One more post. Maybe the acres really burned in the past but they swept through a mature forest and left the trees alive. The same forest could be burned every few years. He does not dissect the fire suppression histories but goes back 70 years from 1993 so that would be 1923.
–
He says that “70 years of fire suppression policies has shifted presettlement fire regimes from frequent low-intensity surface fires to infrequent, but increasingly numerous,
large catastrophic crown fires. ” So the acres burned but did not burn down all the trees.
Maybe the Forest Service does not want people to come to the conclusion that fire suppression cased the fires from hell.
Blame Smokey the Bear.
https://www.researchgate.net/publication/6083686_Fire_History_and_Climate_Change_in_Giant_Sequoia_Groves
Fire History and Climate Change in Giant Sequoia Groves
December 1993Science 262(5135):885-9
DOI: 10.1126/science.262.5135.885
SourcePubMed
Authors:
Thomas William Swetnam
The University of Arizona
It’s understandable, eric, that they wouldn’t want people to reach a false conclusion. At least among State institutions since California is a non-science-denying State. Federal institutions are another matter, or at least were during the Trump era when the professionals were censored and over-ruled by science-denying political appointees at the top.
A lot has happened since 1993. Including most of that 1°C of global warming and 1.5°C of land warming. But also including forest research.
It’s quite possible though, even likely, that current practices worked OK before but are out of sync with the current climate. Larges areas of forest are already in a chaparral climate-biome not a forest climate-biome. The only things keeping them as forest are inertia and the forest’s own microclimate. Disequilibrium of fire-prone forests sets the stage for a rapid decline in conifer dominance during the 21st century. Pervasive shifts in forest dynamics in a changing world.
This a really good, detailed case study of a small area, although perhaps somewhat dated because data only stretches to 1995 so predates both most global warming and the recent mega-fires. Spatial patterns and controls on historical fire regimes and forest structure in the Klamath Mountains (the USDA site is easiest to find but the full paper is in a peer-reviewed journal). See Table 4. While it is true that Native Americans used fire as a forest management and clearance tool, with 15-30 year intervals between burns (I wonder if that was a human-generation-time thing rather than a finely tuned interval), and from the stats it looks like early Euro-American settlers did the same, that changed more than a century ago and so doesn’t explain the recent terrible events, only 20th-century business-as-usual.
Interestingly, they did have fires like the recent ones back in the Medieval Warm Period. Which, yes, was real, but it wasn’t global and wasn’t simultaneous, so it was totally unlike the last three decades other than locally. And we’re now warmer anyway. See “the Hockey Stick”.
Presumably Native Americans lived there a millennium ago, and there’s no reason to think they would not have followed the same pre-European burn practices. And yet that didn’t prevent mega-fires. So even if reverting to 19th-century burn protocols was tried, like 20th-century protocols there’s no guarantee they would work in today’s new normal, let alone tomorrow’s hotter normal.
And of course a $1M mansion is a bit more of a fixed asset than hunter-gatherer settlements which can easily be moved and rebuilt. As is a $100k bungalow.