
There’s a bizarre article in the Wall Street Journal by Fred Singer called, The Sea Is Rising, but Not Because of Climate Change. It’s actually so bonkers that it’s quite hard to know where to start. I’ll give it go, though.
It says
It is generally thought that sea-level rise accelerates mainly by thermal expansion of sea water, the so-called steric component.
I note particularly that sea-level rise is not affected by the warming; it continues at the same rate, 1.8 millimeters a year, according to a 1990 review by Andrew S. Trupin and John Wahr. I therefore conclude—contrary to the general wisdom—that the temperature of sea water has no direct effect on sea-level rise. That means neither does the atmospheric content of carbon dioxide.
The steric component of sea level rise is due to the thermal expansion of sea water. The rate at which it rises depends on the rate at which energy is being added. It doesn’t have to be accelerating for the rise to be due to thermal expansion.

Credit: Chen et al. (2017)
A key point is that the oceans have, by far, the largest heat capacity of the climate system. Sea level is a very strong indicator that the climate system is accruing energy. The only way this can happen is that there is more energy coming into the system, than going out, and the reason this is happening is because we are dumping CO2, and other greenhouse gases, into the atmosphere, which reduces the outgoing long-wavelength energy flux.

Credit: Hansen et al. (2016)
But there is also good data showing sea levels are in fact rising at an accelerating rate.
Well, yes, as the figure on the left (from Hansen et al. (2016)), shows sea level rise is indeed accelerating.
So, sea level is rising and its accelerating, and this is almost entirely due to anthropogenic influences. This is primarily our emission of greenhouse gases into the atmosphere, which is producing a planetary energy imbalance that is resulting in the accrual of energy in the climate system. This leads to both thermal expansion of the ocean and the melting of land ice. It can’t really be anything else.

There were some amusing tweets about the article. Michael Mann had
Chris Colose had
Actually, I think Chris Colose’s tweet may be more because of this article which highlights a Republican Congressman saying things like
As it happened, a new paper appears with more authors than your average CERN announcement.
https://www.earth-syst-sci-data-discuss.net/essd-2018-53/
Ocean thermal expansion, glaciers, Greenland and Antarctica contribute by 42%, 21%, 15% and 8% to the global mean sea level over the 1993-present. We also study the sea level budget over 2005-present, using GRACE-based ocean mass estimates instead of sum of individual mass components. Results show closure of the sea level budget within 0.3 mm/yr. Substantial uncertainty remains for the land water storage component, as shown in examining individual mass contributions to sea level.
Since Jan 2015:
Look at OHC since Jan 2015:
The problem here isn’t with what F. Singer thinks or says but with the editorial standards of The Wall Street Journal specifically and News Corporation publication generally. Is it any surprise that climate science denial memes are so widely believed? Is this an example of the true intent of that US constitution’s freedom of press provision – that the press are free to publish BS in support of the owner’s own political views?
@-Ken Fabian
“The problem here isn’t with what F. Singer thinks or says but with the editorial standards of The Wall Street Journal specifically and News Corporation publication generally”
They may just be willing enablers of an early salvo in a PR campaign.
To make a falsifiable prediction;
Expect to see this followed up with more articles and media exposure of such ‘contrarian’ positions from Heritage/Cato foundation types over the next two weeks.
It is timed to try and negate the – “ Warmer weather increases AGW credibility” effect.
It is really bizarre. A rambling mess which seems to have paragraphs cut and pasted randomly and adjacent sentences are directly contradictory.
States that the data shows sea level rise is accelerating, but then a couple of sentences later says he’s trying to find an explanation for an observed static rate.
At one point concludes that increased evaporation causing ice sheet accumulation must be the answer to a static sea level rise rate, but then for no apparent reason decides that it has to 100% cancel the steric rise and that this presents a problem because the sea level is rising.
Genuinely have no idea how a casual audience would react to this. Amusingly, the Watties have honed in on and are rather put out by the suggestion of sea level rise acceleration.
> A rambling mess which seems to have paragraphs cut and pasted randomly and adjacent sentences are directly contradictory.
I did not write it.
Probably worth highlighting one of Eli’s posts about Roger Revelle, Justin Lancaster and Fred Singer
“The steric component of sea level rise is due to the thermal expansion of sea water. The rate at which it rises depends on the rate at which energy is being added. It doesn’t have to be accelerating for the rise to be due to thermal expansion. “
climate skeptics seem to run quite regularly into difficulties when differentiating/differencing signals. This is at the heart of Salby’s basic argument, ISTR Svensmark had a report that made the same mistake, and Humlum et al. etc. Perhaps Singer had read Jamal Munshi’s “paper” (I think that is the right one, but he has produced quite a few of these over the last few years) which argued correlations are spurious unless the derivatives are also correlated (which is obvious nonsense, but will fool those who wish to be fooled). He brought it up in a twitter discussion recently, but seems to have deleted his contributions, for some reason, which leaves the discussion looking a little odd!
Strange that Munshi would delete those tweets.
Ah, that is interesting, I can’t see the posts on twitter but I can see them here, but don’t seem to be blocked…
Yes, they still seem to there, but they don’t seem to be appearing in the Twitter thread.
Glad it’s not just me then!
Is there not something disturbing about figure 1 (Chen et al 2017). Adjusted there is accelarating and unadjusted there is deaccelerating. Always there are these adjustments to make something happening. What is wrong with things as measured?
ATTP
“The article by Fred Singer then appears to completely contradict itself. After suggesting that sea level rise is not accelerating, he goes on to say But there is also good data showing sea levels are in fact rising at an accelerating rate.”
–
Fred Singer
“I chose to assess the sea-level trend from 1915-45, when a genuine, independently confirmed warming of approximately 0.5 degree Celsius occurred. I note particularly that sea-level rise is not affected by the warming; it continues at the same rate, 1.8 millimeters a year, according to a 1990 review by Andrew S. Trupin and John Wahr. I therefore conclude—contrary to the general wisdom—that the temperature of sea water has no direct effect on sea-level rise. That means neither does the atmospheric content of carbon dioxide.
This conclusion is worth highlighting: It shows that sea-level rise does not depend on the use of fossil fuels. The evidence should allay fear that the release of additional CO2 will increase sea-level rise.
But there is also good data showing sea levels are in fact rising at an accelerating rate. The trend has been measured by a network of tidal gauges, many of which have been collecting data for over a century.”
–
He is talking about two different sets of data. His comment on sea level rise not accelerating is based on a particular time period with known CO2 and temp and sea level rise data.
The two sets of data do show contradictory results, not his take, just the data.
His conclusion might be right based on the parameters he put in.
His conclusion is wrong for the same reason used recently on the ECS, natural variability might hide the effects of CO2 increase.
Raymond,
I think the adjustment is due to satellite drift. I don’t think it is possible to simply make this measurement. I think you always have to apply some kind of adjustment in order to extract the signal from all the data has been collected.
“We further examine closure of the sea level budget, comparing the observed global mean sea level with the sum of components. Ocean thermal expansion, glaciers, Greenland and Antarctica contribute by 42 %, 21 %, 15 % and 8 % to the global mean sea level over the 1993–present. Substantial uncertainty remains for the land water storage component, as shown in examining individual mass contributions to sea level.”
86% related to increasing global temp? but 14% unaccounted for. There is a secondary storage, the land rivers and underwater aquifers and a tertiary one, the atmosphere. How many mls of sea level is actually floating in the sky on any one day and how variable and important is this on cloudier worldwide days? How many centimeters are trapped on land after heavier than normal monsoon events?
Most of the deeper ocean plays no part in expansion, in fact there would be a slight contraction of the lower sea volume if it ever got a bit warmer.
I am a bit bemused by the glaciers, Greenland and Antarctica numbers, I would have thought that glacier melt would include most of the Antarctic and Greenland contribution as one figure. Blowed if I know how Antarctica and Greenland lost ice other than by glacier melt.
angech,
I think you’re simply being pedantic. I’m pretty sure they mean other glaciers, not that there are no glaciers on Greenland or in the Antarctic.
Yes, it’s a giant conspiracy dictated by Prince Philip and myself from our undersea volcano.
That wouldn’t allow Phil and I to dictate our desired World Gubmint to the unsuspecting Sheeple.
My advice is to buy AK47s and tinned food to maintain your liberty. But remember, Phil and I know where you live!
Angech always plays the denier shuffle move. Find some minor issue, imply an implausible meaning to it, and then use the Angech strainer to demand everyone else ignore reality.
The WSJ editorial is paywalled so the following is based on the WUWT version which I presume is the same.
It is difficult to parse, but I think that Singer is arguing that because the rate of sea level rise did not change during the period of rising temperature, that rise in temperature had no impact on sea level.
This contains the implicit assumption that there is a constant background rate of sea level rise if temperatures are constant.
While that is never explicitly stated it seems an inescapable element of his chain of reasoning. Can anyone formulate an alternative interpretation of his theory?
Again it is implicit, but some of the WUWT responses seem to address this in suggesting mechanisms that could provide a constant rate of sea level rise in the absence of a temperature rise.
Perhaps the most revealing in exposing a profound lack of s nose of scale is the idea that sediment run off and coastal erosion can cause sea level rise. Given the relative areas of land and ocean, the sea level rise of the last century would have required about the top 40ft of the US to have been dumped into the ocean.
I suspect Dave-G might have a better insight into such geological ales of change.!
Groundwater mining

The Great Tamino is doing interesting work in isolating sea-level rise from natural variations.
These (433-day, 12.8-year) lunisolar-related cycles can be isolated from the SLH time-series, leading to a signal that contains more of the trend. A pro-tip for those that are looking at doing more of this analysis: if the SLH readings are computed as differences in 2-year intervals, the lunisolar pattern becomes more striking. Why is the biennial factor important? That’s the natural non-linear doubling of the annually-forced ocean volume. The 433-day and 12.8 year signals are precisely determined as physically aliased harmonics of the strongest lunar cycle mixed with a biennial signal. Cool stuff that Tamino has uncovered.
Singer:
”
The cause of the trend is a puzzle.
“
To me the surprise wasn’t the garblings of the elderly and increasingly frail Singer, but that this was the best the Murdoch-owned WSJ (still the second largest newspaper in the U.S.) could come up with. What an embarrassment.
It’s always preferable to cite your source, TE, if you know it.
Leonard F. Konikow (2011), Contribution of global groundwater depletion since 1900 to sea‐level rise, Geophysical Research Letters
Lots Raymond. But just for fun let’s remove the adjustments from surface temperature datasets.
Oh look, the world is warming even faster than the IPCC says! Quick Raymond, get out there and demonstrate against Trump and Pruitt! You know it makes sense to an unadjusted data fancier!
From the other thread, h/t dikran:
Jack Vance, The Languages of Pao.
…and Then There’s Physics says:
“I think you’re simply being pedantic. I’m pretty sure they mean other glaciers, not that there are no glaciers on Greenland or in the Antarctic.”
You are right.
The concept though is 3 different glacial volumes. Antarctica being presumably largest but slowest melting as coldest of the 3 groups, 8%, Greenland a tad warmer but a lot smaller 15% and the rest of the worlds glaciers, [would this be a smaller volume?] but warmer again so the most melt 21%.
Eli Rabett put the article up.
The determination of the causes of sea level rise and how it is difficult to work them out are discussed. As are my thoughts on where all the water goes.
Peter’s argument seems wrong in application.
Minute changes in Sea level rise and ocean temperatures are very hard to use backward, almost like a proxy, to show that the world has been warming/not warming. The amount of change usable as proof for or against AGW is harder to quantify than direct atmospheric temperatures.
Not a good argument for either side really.
One of the better AGW ones.
I would not want to go there.
angech,
I really don’t follow what you’re suggesting. Sea level rise is a very strong indicator of AGW. It’s extremely hard to explain it in any other way.
@-TE
“Groundwater mining”
About 10% of the total measured rise over the last hundred years.
Requiring causes for the other 90%.
There is a mainstream narrative that balances the sea level rise with steric expansion and land ice melt. The angtechian quibbles raised about the standard model appear to want to negate the possibility of any sea level. Or as a fall-back position, as with Singer, there is some ‘Natural’ process, (ABC) that explains sea level rise without any significant human influence.
That tactic has dwindled to a crank fringe for surface temperature rise, the reality that it has got warmer is generally accepted.
Stuff expands when heated, so it seems odd to reject the inevitable consequence of a cause that is established.
Wen it comes to bizarro theories about sea level rise, the Wall Street Journl doesn’t have a monopoly. For example…
In the last two days, there have been two laughable claims about sea level rise. The first was yesterday when the Wall Street Journal published a ridiculous piece by Fred Singer claiming that climate change had nothing to do with sea level rise. Today, North Alabama Congressman Mo Brooks suggested that it was rocks falling into the ocean. Interestingly, Brooks represents the district where NASA’s Marshall Space Flight Center is located.
The quote from my previous post is the lead paragraph of Dan Satterfield’s blog post:
“The amount of change usable as proof for or against AGW is harder to quantify than direct atmospheric temperatures.”
The steric component is due to warming oceans. If not AGW, what is causing the oceans to warm? Glaciers melt/calve because of warming. If not AGW, what is causing the warming that results in glacier melt/calving?
An how many times do you have to be told that proof is for mathematics, typsetters and alcohol, in science we only have reduction to the best explanation, you can’t prove anything and disproving is not as straight-foward as people make out.
If you are not just wating our time again angech, I would appreciate direct answers to the two questions I have posed above, if the answer is not “its AGW” then you need to give a physical mechanism that can plausibly explain the observed magnitude of the effect.
The quote from my previous post is the lead paragraph of Dan Satterfield’s blog post:
Is There Something in the Water This Week?, Dan’s Wild Wild Science Journal, AGU Blogosphere, May 17, 2018
Here’s the url for Satterfield’s blog post:
https://blogs.agu.org/wildwildscience/2018/05/17/is-there-something-in-the-water-this-week/
Dikran: I wouldn’t be surprised if Angech were to also embrace the explanation presented in the following article…
Report: Ocean Levels Could Rise Foot Or More If Lots Of People Go Swimming, The Onion, March 10, 2014
No need for any direct provocation, JH.
The following article nicely captures the exchange between Rep Mo Brooks (R-AL) and Philip Duffy, Ph.D., President of the Woods Hole Research Center at the May 16 Hearing of the House Science Committee.
Republican Member of Congress Tells Scientists Rising Sea Level Caused by More Dirt on Ocean Floor by Jonathan Chait, Daily Intelligencer, New York Magazine, May 17, 2018
Groundwater mining versus those pesky dam building beavers:
TE,
I will see your ground water depletion and raise you reservoir impoundment.
https://link.springer.com/article/10.1007/s10712-016-9399-6
JCH,
LOL!
Great minds and the power of google!
I luv that dam graph.
HH:
I’ll see your reservoir depletion and raise you a solar evaporation mitigation
https://www.researchgate.net/publication/325150235_Engineer_solar_solutions_locally_to_save_water#share
Needless to say, sea level rise is of vital concern to Pacific Island nations including New Zealand…
In his new book, The Water Will Come, author Jeff Goodell compares sea-level rise to gravity, “an essential fact of our time” that will reshape the world as we know it.
The journalist and contributing editor at Rolling Stone toured the world to report on the front lines of a coming crisis he says echoes the myth of Atlantis, a great city drowned by the ocean. With projections of up to 2m of sea-level rise by the end of the century, hundreds of millions of people will be displaced, ushering in a crisis of unprecedented proportions in the modern world.
In his reporting, he spoke to Pacific Islanders who have the sea washing at their feet and the developers of glistening towers in Miami; He spoke to scientists, activists, and Barack Obama.
Ahead of his visit to New Zealand – a coastal nation that will have its own reckoning with the rising sea – Goodell spoke about the stakes involved, the hubris of human beings, and the climate change denier his countrymen elected to the presidency.
‘A profound crisis’: Sea-level rise and the remaking of the world by Charlie Mitchell, Environment, stuff.co.nz, May 13, 2018
Mitchell’s Q&A with Goodell is definitely worth perusing.
First up the WSJ was very skeptical before Murdoch bought it. But that is an aside. I remember a couple of years back The Spectator ran an article by Nils-Axel Mörner that pretty much stated that if you turned the satellite data to the side then it showed no sea level rise. Its not the sort of thing you would see in the FT or Economist. The Spectator is aimed at the old duffers in the home countries who are seething at everything since the Beatles released Help! But the Economist, FT and WSJ are supposed to be aimed at professionals who rely on data for their bread and butter, whenever the WSJ releases articles like this I always assume its a bit of a nudge and a wink more aimed at slowing the demand for action on climate change than from any heart felt views in support of this kind of silliness.
JCH, look at your chart.
Hypothetical net of groundwater and dams is still positive and accelerating.
Going forward, dams are probably a net contributor also, since no more dams appear to be in the offing:
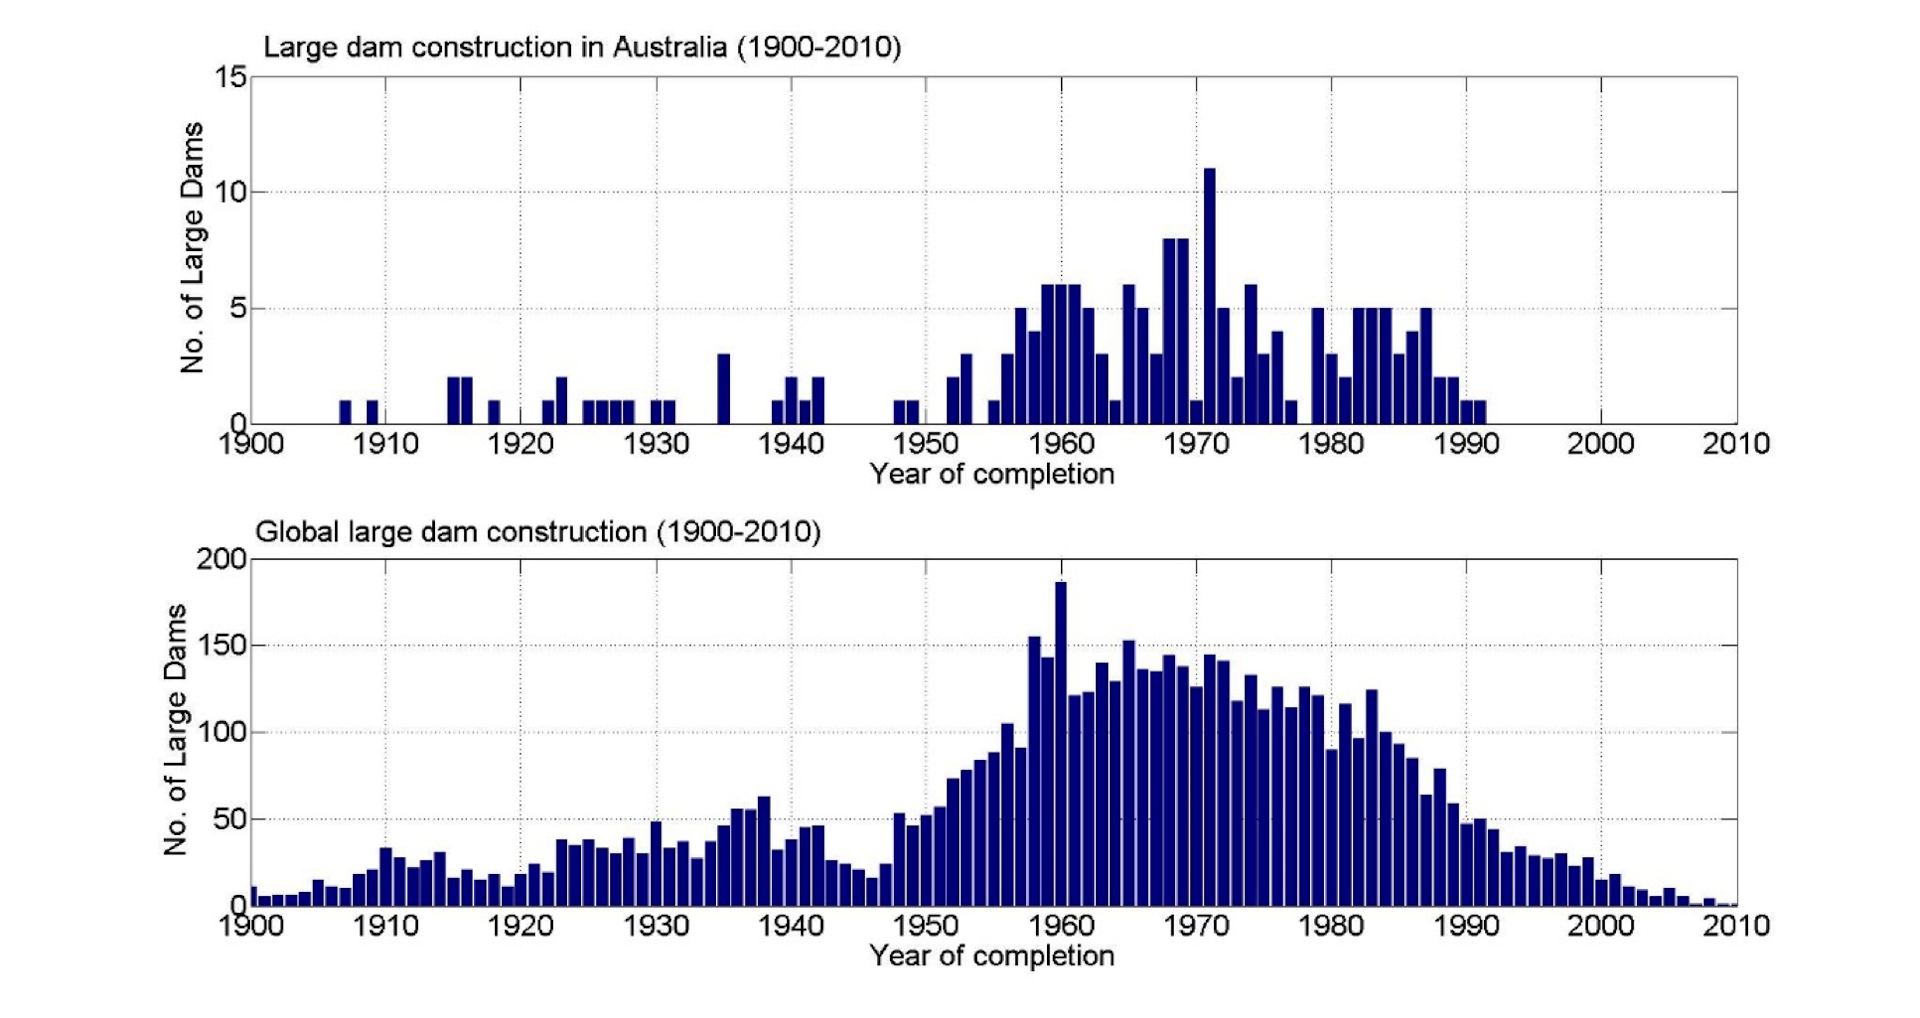
And existing dams tend to fill with sediment, with the difference being net contribution to the oceans in addition to ground water mining.
@-TE
“Going forward, dams are probably a net contributor also, since no more dams appear to be in the offing:”
That suggests that a river with no dam contributes to sea level rise.
Dams may sequester some water on land, a diminishing amount as they fill with sediment, but that is not a significant volume that would impact sea level rise rates.
The idea that NOT building a dam would cause sea level rise indicates a deep ignorance about the water cycle. Rivers are fed by rain, that evaporated from oceans, they have no ‘extra’ water they can contribute to the sea.
Urbanization increases surface runoff by creating more impervious surfaces such as pavement and buildings that do not allow percolation of the water down through the soil to the aquifer. It is instead forced directly into streams or storm water runoff drains, where erosion and siltation can be major problems, even when flooding is not. Increased runoff reduces groundwater recharge, thus lowering the water table and making droughts worse, especially for farmers and others who depend on the water wells.
ScottD for the win:
https://twitter.com/airscottdenning/status/997509945816793089
Since New Zealand and Australia are being mentioned, this is the natural year-to-year sea-level-height variation in Sydney harbor over the last +100 years.

This comparison is suggesting that SOI = k f(t) − k f(t−Δt) where f(t) is the SLH tidal record, Δt=2 years, and k is a constant. The two-year differencing brings out the Pacific ocean dipole signal, which would otherwise be obscured.
Another example of a variant transformation used to detect a pattern in the data.
The golden age of dam building did offset, more than offset, progressively increasing groundwater mining for decades, but that era is over. So yes Izen, for decades dam construction was mitigating the sea level rise ground water mining causes. Out of the underground holding pond and into a brand-new, manmade lake. That is what the graph is showing. The gray line is net contribution; prior to wrong 2000, it’s negative.
The best sites have, for the most part, been built. There are cases where dams are being removed.
There is always the Grand Canyon. It would make on heck of a lake.
I have no idea why TE brought it up.
Increasing the beaver population subtracts ~ 10,000 cubic meters of water from the ocean per new beaver.
OTOH, as beaver ponds have a lower albedo than forested land, and the radiative forcing per new beaver lifetime is equivalent to the annual CO2 production of several SUV’s.
Calculating the sea level rise equivalent of a beaver hat is left as an exercise for the reader.
‘…if the answer is not “its AGW” then you need to give a physical mechanism that can plausibly explain the observed magnitude of the effect.”
Assume the LIA plus a warming due to cycle long enough have the LIA be a low point in the GMST. Ice is not a snowflake. At first it absorbs. Then it reaches a critical point and starts producing liquid. Ice has the ability to lag.
The contribution numbers above show this with tiny glaciers contribution the most. Since the ice masses of Greenland and Antarctica have more cold storage to run through before reaching critical.
Assume the LIA plus a warming due to cycle long enough have the LIA be a low point in the GMST. …
I’d rather go out to the garage and perform a root canal on myself with my drill press.
Russel, Ragnaar lives in Minnesota, where everybody knows not to camp below a beaver dam:
@-Ragnaar
“Assume the LIA plus a warming due to cycle long enough have the LIA be a low point in the GMST. “
That requires the assumption that there is a long cycle of unknown cause, as yet undetected, that could cause warming from the LIA.
Warming that has caused surface temperatures and a sea level rise not seen since the Holocene maximum about 7000 years ago.
It is also an unknown cycle that has added gigaJoules of energy to the oceans.
But worse, you also need to assume that the observed consequences of raised CO2, stratospheric cooling, largest rise in winter, nighttime temperatures, has for some unexplained reason, NOT happened, but has been perfectly imitated by this magical warming ‘cycle’.
Why would you invent a process for which there is no evidence and good arguments from physics, why it is not possible, while rejecting the observed physical process that we know causes warming?
ragnaar wrote “Assume the LIA plus a warming due to cycle long enough have the LIA be a low point in the GMST.”
That is not a physical mechanism, just labels for things you find in the observations (which in the case of cycles may or may not even be there).
dikranmarsupial says:
“I would appreciate direct answers to the two questions I have posed above,”
1.
“The steric component is due to warming oceans. If not AGW, what is causing the oceans to warm?” if the answer is not “its AGW” then you need to give a physical mechanism that can plausibly explain the observed magnitude of the effect.”
Sea level rise is one of the better AGW ones.[answers].
–
” Glaciers melt/calve because of warming. If not AGW, what is causing the warming that results in glacier melt/calving?”
AGW could help melt glaciers.
–
“And how many times do you have to be told that proof is for mathematics, typesetters and alcohol, in science we only have reduction to the best explanation, you can’t prove anything and disproving is not as straight-foward as people make out.”
–
Warming not related to AGW, is still legal I believe. Glaciers can melt for several reasons other than warming but your points are valid if not proof.
@ JCH
I haven’t witnessed a natural failure of an active (as opposed to abandoned) beaver dam, and that one looked like it was in fine shape before the breach. Rather than “Natures Engineering Disaster” I suspect it was some yahoo with dynamite.
I dropped by WUWT for the first time in a while to see what the Watties thought about sea level rise. As could have been predicted it was a full-blown Dunning-Kruger carnival. I still find it remarkable to see people making wildly incorrect statements, in public, with (apparently) complete confidence.
Magma, there are two possible natural outcomes on which you can bet. One, the beaver dam eventually breaks; or two: after couple of 100 years, the beaver pond fills with sediment.
Unless, of course, those pesky beavers have taken up sound sediment dam management practices:
I’ve seen some huge beaver dams. There was one hiking along the BWCA Pow Wow trail in N.Minnesota that must have been dammed up a mile long. Also you can see them on Google Earth in regions like the Quetico of Canada, just huge in the middle of nowhere. People will flag them occasionally on the app. Not that it makes any difference to sea-level.
“The steric component is due to warming oceans. If not AGW, what is causing the oceans to warm?” if the answer is not “its AGW” then you need to give a physical mechanism that can plausibly explain the observed magnitude of the effect.”
–
Twentieth century sea level: An enigma Walter Munk*.
Have you or JCH or maybe ATTP read this article and could it form a rebuttal of sorts to the concept of AGW as the sole cause of sea level rise.
If I understand it it suggests that rotational spin of the earth alone changing by 1 ms a hundred years may have been enough to cause sea level rise or fall on a level similar level to what you have ascribed as purely a steric response. It is very heavy reading.
–
“Changes in sea level (relative to the moving crust) are associated with changes in ocean volume (mostly thermal expansion) and in ocean mass (melting and continental storage):
The Levitus compilation has virtually foreclosed the attribution of the residual rise to ocean warming (notwithstanding our ignorance of the abyssal and Southern Oceans): the historic rise started too early, has too linear a trend, and is too large. Melting of polar ice sheets at the upper limit of the Intergovernmental Panel on Climate Change estimates could close the gap, but severe limits are imposed by the observed perturbations in Earth rotation. Among possible resolutions of the enigma are: a substantial reduction from traditional estimates (including ours) of 1.5–2 mm/y global sea level rise; a substantial increase in the estimates of 20th century ocean heat storage; and a substantial change in the interpretation of the astronomic record.
If steric, this residual rise would require 1024 J of 20th century incremental heat storage, far in excess of the measured and modeled 2 × 10²³ J.
A radical downward revision of the global mean rise would go a long way toward resolving the enigma.
We are left with a eustatic [not steric] interpretation of the residual sea level. Here the situation presented by the authoritative IPCC 2001 report is not promising. Terrestrial storage (reservoirs − groundwater = −6 + 4 = −2 cm/cy equivalent sea level) almost cancels glacial melting (+3 cm/cy), giving essentially a net zero 20th century contribution with very wide error limits, −9 to +8 cm/cy.”
Perhaps this is what TE was on about?
“About 0.5% to 1% of the total volume of 6,800 km3 of water stored in reservoirs around the world is lost annually as a result of sedimentation.2 As a result, global per capita reservoir storage has rapidly decreased since its peak at about 1980. Current storage is equivalent to levels that existed nearly 60 years ago.2“
https://www.hydroworld.com/articles/print/volume-25/issue-1/features/dealing-with-sediment-effects-on-dams-and-hydropower-generation.html
Why not just go the whole hog, Ragnaar, and assume unicorns? Or sky-dragons? Or shape-shifting alien space-lizards?
Of course, some of that sediment would otherwise make it to the oceans.
But some other of that sediment would bolster coastal land, like New Orleans and the Mississippi delta.
I did see one a few weeks ago on a nature documentary. But an observant downstream resident would have sussed that something was up. The beavers had abandoned it and built a new one upstream. IIRC the film-makers were not very observant. They were focused on filming the kits in the den and had presumably interpreted the regular absences of the parents to them going farther afield for food. They only followed when they saw the parents moving the kits and realised there was a new dam. Interesting that they moved upstream. Smart enough to know that if the old one had silted up, the silt would just pour into the new one if they built it downstream? The old one failed soon after. I can’t remember if they cannibalised it for materials once the kits were out, or if it just failed for lack of regular maintenance. They certainly seem to be well equipped for rebuilding, so maybe maintaining one is a “Red Queen” exercise:
Well, it would if the distributary channels weren’t leveed and canalised. But since they are it all goes into the sea. Bolstering coastal land with river sediment requires you to flood it. Kinda awkward if it’s covered in houses, offices and shopping malls 😉 .
Munk is a but outdated angech. Reassessment of 20th century global mean sea level rise.
“…I think that Singer is arguing that because the rate of sea level rise did not change during the period of rising temperature, that rise in temperature had no impact on sea level.”
Could be. It’s also possible what he wrote was edited and that left something out. The AR5 figure 3.14 concerning SLR shows SLR from about 1900 to 1950 of 1 to 2 centimeters per decade. As portrayed in what I assume is a summary for policymakers, the Altimetry looks to me like a recent snapshot.
Now to tie it all out, we can assume a gold standard for the Altimetry and tie it to a fuzzy past. An accounting tie balances gains and losses to two known static measures from different times. ARGO is also a recent addition. And then we had Trenberth’s Tragedy. Which told one way is, they forgot to look for steric SLR. And once they looked for it, those error bars tighten up nicely.
AR5 is several years out of date Ragnaar (2013-14). Science Moves On. From a year ago: Reassessment of 20th century global mean sea level rise.. Synopsis a couple of posts up.
And what on earth is “Trenberth’s Tragedy”. Do tell, I could do with a laugh.
Pingback: Het Achterhoedegevecht | Klimaatverandering
“A growing number of scientists, conservationists and grass-roots environmentalists have come to regard beavers as overlooked tools when it comes to reversing the disastrous effects of global warming and world-wide water shortages.”
http://www.pbs.org/wnet/nature/leave-it-to-beavers-leave-it-to-beavers/8836/
Large rodent extermination causes global warming. I had a beaver attempt to dam the outlet, next to my office, of a 140 acre lake. I called the watershed district and asked, what do I do? They said wreck it. Which I did 5 times until the beaver gave up. I’d have let it slide if the beaver worked for the watershed district.
Wow, that’s huge!…
But when you apply 3.3 millimeters of rise to the entire ocean? We’re talking about a lot of water that’s displaced — 3.3 millimeters across about 362 million square kilometers of surface area. The total volume displaced, then, would be 1.19 trillion cubic meters of water…
So to make the oceans rise 3.3 millimeters, we would need to displace that 1.2 trillion cubic meters of water upward by dropping in 1.2 trillion cubic meters of dirt or stone or whatever.
How much is that? It’s a sphere of earth a bit over 8 miles in diameter…
Here’s how big a rock you’d have to drop into the ocean to see the rise in sea level happening now, Analysis by Philip Bump, Politics, Washington Post, May 17, 2018
@ Dave
As I recall, Ragnaar mentioned that a month or two ago, although he called it a “travesty” then.
As best I could tell, R was referring to Trenberth’s lead authorship of an AR3 chapter that included a range of forecasts of future sea level rise. In other words, it appears to be a criticism of Trenberth’s failure to correctly predict and incorporate research findings developed fifteen to twenty years later.
After all, what’s the point of having a time machine if you don’t use it?
Jevrejeva et al., 2008
Click to access 2008GL033611.pdf
Their figure 1 shows something starting when ships used sails and our population was much less. That since 1950 may have been tied out, still leaves us lacking an explanation for periods prior to that. Mann’s climate break is at about 1920 which trails the SLR response occurring in about 1800.
There are oceans with varying amounts of clouds and until recently, poorly measured temperatures and overall, poorly quantified circulations. Used as a place to put everything we don’t know.
The Travesty:
https://skepticalscience.com/Kevin-Trenberth-travesty-cant-account-for-the-lack-of-warming.htm
The following list gives the amount of energy going into various parts of the climate over the 2004 to 2008 period:
Ocean: between 20 to 95 x 1020 joules per year
SkS portrays him as an obsessive accountant. I am an accountant. The above means, I really don’t know. I think I am going to withdraw from this engagement as I am not fond of being sued.
angech,
Twentieth century sea level: An enigma Walter Munk*…
If I understand it it suggests that rotational spin of the earth alone changing by 1 ms a hundred years may have been enough to cause sea level rise or fall on a level similar level to what you have ascribed as purely a steric response. It is very heavy reading.
You don’t understand it. What it’s saying is the other way around: that loss of mass from the ice sheets and consequent increase in ocean mass would have an effect on Earth’s rotational spin. His conclusion is that the available observations do not support such a change, or rather a large enough change to explain the magnitude of observed sea level rise as dominated by mass change.
The enigma was that we had estimates of historical sea level rise from tide gauge reconstructions which were much larger than were indicated by combining modeled thermosteric rise due to greenhouse gases and estimates of possible mass increases (including constraint by rotational spin history).
The Munk enigma was has been answered by Gregory et al. 2013 and Mitrovica et al. 2015.
Summary of the answers to the enigma:
– Munk’s modeled thermosteric rise was too small, particularly in the early 20th Century, because the model runs began in 1900 and didn’t take into account the recovery from very strong volcanic cooling in the 19th Century, or potentially positive 19th Century anthropogenic forcing.
– Munk’s geophysical constraints were based on observations which contained errors. Fixing those errors apparently relaxes the rotational constraint against significant mass losses. Long-term estimates of glacier contribution suggest glacier losses explain a large fraction of early 20th Century SLR.
– 20th Century sea level rise may not have been as large as indicated at the time of Munk 2002. Recent reconstructions have tended to suggest rises in the range of 1-1.5mm/yr rather than 1.5-2mm/yr.
izen:
1950. You’ve explained post 1950. Pre, let’s go with random. Pre there wasn’t much CO2. So CO2 takes over random and then explains just about all.
We have a company that doesn’t do anything special but stays in business. We spray it with money and it has a lot of money. Then I ask, what does the company make? The answer is, it has a lot of money.
The Nile delta gets almost no sediment.
But what is the point? It appears to be “throw yet another pile of stuff against the wall.”
.6 mm/yr – first decades of the 20th century
1.2 mm/yr – 1900 to 1993
~2.0 mm/yr – 1993
3.3 mm/yr – 1993 to present
4.3 mm/yr – last 10 years
4.7mm/yr – last 5 years
no dips below satellite-era trend since Jan 2015 – longest period like that in the satellite era – no end to it in sight.
But sediment.
Ragnaar
1) 2017 is newer than 2008. To repeat, Science Moves On. BTW did you spot the question mark at the end of the title of the 2008 paper? Did it make you stop and think? Their last few sentences:
So (a) within the IPCC range and (b) they say IPCC projections are very likely too small. Not much comfort there for residents of Denierville. Quite the reverse.
2) h/t magma. AR3? From 2001? Science Moves On.
3) You linked to the SkS post which debunks denier lies about Trenberth’s email! Note to lawyers: my definition of lying includes any intentional deception, even when weasel-words can be used to say it wasn’t an actual outright lie. That includes cherry-picking, out-of-context quotes and quotes which have been truncated so that naive readers can be fooled into thinking the author meant something he didn’t mean.
Seriously dude, you have to learn how to stop shooting yourself in the foot if you hope to get any traction.
It appears to be “throw yet another pile of stuff against the wall.”
And this sounds like denial of anything which even modifies a single pre-exisitng idea.
And Ragnaar
CO2 forcing is logarithmic with concentration, so early on, a little goes a long way. See, for example, Fig. 2a of this (LLGHG). It really took off in the 1960s, but was already significant by 1950.
Dave_Geologist:
Yes the ending was straight forward and not too long.
Did you read their explanations for let’s say pre-1950 SLR?
If we’re counting maybe ten years, AR5 was in 2013 and I’ll give those people a little credit.
It was hoped the SkS link would establish what happened. The skeptics didn’t matter to that. It seems that Trenberth thought that things didn’t add up. Something like, We can’t find it. SkS describes him as: “an obsessive accountant”. Now what happens prior to hiring an obsessive accountant? Usually whatever caused the need for the new accountant.
So do I Ragnaar, Some science is superseded quickly, some slowly, some not at all (so far).
When a puzzle or anomaly presents itself, often that prompts scientists to investigate further and find out what is going on. They may find that the original proposed explanation was right, or maybe it was wrong, or maybe the puzzle was only apparent and due to a problem with the measurements or the way they had been interpreted. Refusing to accept that Science Moves On is like a God-of-the-Gaps evolution denier who doesn’t just commit the initial Gaps fallacy, but also refuses to accept that the gaps have been filled, even after they have been filled.
To repeat, Science Moves On.
Ragnaar: The SkS rebuttal article you have referenced, Trenberth talks about energy flows and global warming comes in two versions – Intermediate and Advanced.. You linked to the Intermediate. Have you read the Advanced?
O.K. Angech said
So I challenged him to state if not AGW some other physical mechanism that could plausibly explain the magnitude of the effect, and he came back with nothing but trolling:
I had just asked him to state what non-AGW warming could be responsible, yet he comes back with this rhetorcial bullshit about it being “illegal”. Sorry angech, you can’t get away with peddling your persecution narrative when I have just invited you to make the opposite case.
I said
angech replied with:
Sorry angech, I realise I misread your post about legal rather than legal. However it is still retorical bullshit as nobody is claiming it is illegal, and it was just avoiding the fact that you had no plausible example of such “warming not related to AGW”.
And this sounds like complaining when your obfuscatory rhetoric gets nailed.
You think Wada and Reager and others who do TWS don’t don’t know about silt? Are you that clueless?
@-Ragnaar
“You’ve explained post 1950. Pre, let’s go with random. …”
Let’s not, As Dave has pointed out there was a CO2 rise before 1950 that would have some effect. There was also land use changes, population growth and agricultural developments that have an influence on the Carbon cycle.
But there is also a modest increase in insolation, and the recovery from the big volcanic events at the turn of 1900s.
The problem with invoking ‘random’ is that it isn’t a thing that has a physical effect. Random is a description of behaviour, not a causative agent.
Neither have you established that there is any verified trend pre-1950s that requires an explanation. We know that Sea level has varied by less than a foot since Roman times, it may have varied, but around a stable mean.
That is clearly no longer the case.
@-“We have a company that doesn’t do anything special…”
I guess this is a metaphorical allusion to Climate Science, the ‘Team’ (of thousands) who have produced over 50 years of advancing knowledge of how our world works.
There are two apochraphal(?) quotes that were made in reply to the complaint that scientific knowledge cost money but had no obvious value.
“What use is a new-born baby.”
“Why sir there is every possibility you will soon be able to tax it!”
So at 3mm a year is 3m per thousand years. Or 3000m per million years. Serious, rocks raise the sea level by 3km every 3 million years on a planet 4.5 thousand million years old.
So we’ve got this:
And this:
And this:
And Occam’s razor. Parsimonious explanation. Physical mechanism that best explains observations.
Your turn.
To be clear, that was @ angech and TE.
@-TTauriStellarBody
“So at 3mm a year is 3m per thousand years.”
Or about a foot per century.
Rather like climate sensitivity estimates from current observations this may be misleading.
Paleo evidence indicates much fasrer rates of sea level rise are possible. And major icecaps can be lost rapidly. The radar survey of Greenland shows it lost half its ice during the Holocene maximum. Regaining it from snowfall, – until recently.
https://svs.gsfc.nasa.gov/4249
Paleo evidence also indicate that land ice is not tenable at Eemian temperatures.Eventually it nearly all goes, radically changing the map of inhabitable surface.
Of course, by then we may have evolved into the four toed nebish. (T.J.Bass)
But even at a foot/century, the impact is not linear.
Sea walls and coastal drainage work, right up to the point where they fail completely.
Even with a low trend, regional differences come into play.
https://e360.yale.edu/features/flooding-hot-spots-why-seas-are-rising-faster-on-the-u.s.-east-coast
izen:
In the past we had a climate that didn’t do anything special. We spray it with CO2 and it has a lot of warmth. Then I ask, what does the climate do? The answer is, it has a lot of warmth.
Here especially in the NH which might be argued to be leading rather than lagging:
there is a break or not. While a physical explanation is requested for the more recent warming, I’d accept any explanation for the break and follow through.
@-Ragnaar
“there is a break or not. While a physical explanation is requested for the more recent warming, I’d accept any explanation for the break and follow through.”
Could you clarify what you mean by the ‘break and follow through.? Are you suggesting there is a discontinuity in the observed trends.?
It is beyond my skills, but I suspect there are people here who can explain breakpoint stats.
https://www.sciencedirect.com/science/article/pii/0003269784904585
Is that acceptance for Any explanation, (But Carbon)?
“Science Moves On.”
The IPCC assessments have the advantage of combining a number of sources. I’d say rightly or wrongly they have more authority than a single study or a small number of studies.
The IPCC model indicates the piano will be moved out of the top floor at a safe, linear rate. In the small print they mention they don’t know how to model a nonlinear piano move out, but they’ve read that has happened in the past. So it’s gotta be linear.
izen:
The boreholes look to be the most damning. The inflection comes too early. The uptick has a beginning. The break.
It precedes the global warming signal emergence which is subject to interpretation but may have been around 1950.
The signal emergence also precedes SLR as in figure 1 here: http://www.psmsl.org/products/reconstructions/2008GL033611.pdf
Late 1700s to 1900:
Jevrejeva:
“And Occam’s razor. Parsimonious explanation. Physical mechanism that best explains observations.”
I think this is the thing most skeptics do not get. To be some scientists dont get it either
because occams razor is a PRAGMATIC RULE, not a scientific rule or logical rule.
A) we have no measure of simplicity that allows us to measure which explanation is
simpler than another.
B) we have no measure of what constitutes a “best explanation” short of simple metrics
about explained variance and average error of prediction.
It is, in the end, expert judgement that rules. Which is another way of saying inter subjective
validity.. consensus. a social construction bounded and constrained by what actually works.
From a pure philiosophical standpoint, of course, one can be skeptical of these razor decisions
and call them “not science”. Except for the fact, the historical fact, that this is how science
actually works in the real world.
Scientists dont need to answer the purist philosophical question. Is there another possible explanation? they just do more science.
Yes, the answer could be something else. It could be unicorns; it could be mystery solar effect;
it could be unidentified long term memory climate process. could be could be could be. we could be brains in a vat. welcome to epistemology 101.
Until some skeptic has an actual COUNTER THEORY to test , then we have what we have:
An explanation that explains what we observe with pretty good accuracy. It’s the best by virtue
of the fact that its the only one. It’s the best by virtue of the fact that there is no credible alternative that explains ( even poorly) the vast vast array of observations— not just temperature, but also clouds, ice, sea surface salinity, sea surface rise, winds, clouds, the list goes on.
Until a skeptic enters the fray with an alternative theory that does as well as the current consensus,
then there is no real science argument. And the alternative theory cannot just focus on temperature. it must do the whole climate, and planetary climate to boot, not just earth. What we have is an argument between skeptics employing philosophical skepticism as a tool for Doubt, and scientists employing methodological skepticism as a tool for improving Knowledge. In some sense, these two groups should not even be talking because with such different aims they can never come to agreement.
The radiative properties of greenhouse gases, principally CO2. Known since the mid 19th Century. The amount of CO2 we’ve put into the atmosphere, known from national and trade association records etc. The isotopic signature of the CO2 which tells us it is (a) organic-derived and (b) has been isolated from the atmosphere for more than 40,000 years.
Physical explanation. Game over Ragnaar. You lost.
The second part can’t be answered as it is an Ill-Posed Question. Pose it better and I might.
@-SM
“I think this is the thing most skeptics do not get. To be some scientists dont get it either because occams razor is a PRAGMATIC RULE, not a scientific rule or logical rule.”
Actually it has an epistemological validation as a legitimate research tool. There is a ‘Principle of Parsimony’. There is also backup from probability theory.
https://plato.stanford.edu/entries/simplicity/
@-“Until a skeptic enters the fray with an alternative theory that does as well as the current consensus, then there is no real science argument.”
Any alternative has to do MORE than that.
It has to explain why the current understanding of the thermodynamics of the system is SO wrong that the observations (temps, sea level, ice melt, etc) are not the result of AGW.
Correct. As a snapshot in time. Now out of date hence the new one in preparation. With plans to keep the next one more in-date. For those Ordinarily Skilled In The Craft, it is possible, and permissible, to incorporate subsequent peer-reviewed knowledge. Providde it has stood up to challenges. You can check that by using the Cited By tab in Google Scholar.
Question Ragnaar. If the IPCC has “more authority than a single study or a small number of studies”, why do you refuse to accept its authority? From the Lewis & Curry thread:
One experiment. More weight than the IPCC report? Double standards, anyone?
Or if I go to Judith’s place, will I see you championing the IPCC range and dismissing LC18 as the one swallow which does not make a summer?
Come on Ragnaar, convince me you’re a true sceptic. Point me to that comment.
Not this one surely:
Seriously? Your water bed heater trumps the IPCC? Which you’ve just told me has “more authority than a single study or a small number of studies”.
Double standards, much.
@-Ragnaar
“The inflection comes too early. The uptick has a beginning. The break.”
You are asserting the existence of a ‘break’ without any justification from the data that it exists as any thing more than a motivated guess from a graph.
You do have a propensity for citing evidence for your position that turns out to refute it, often it validates the opposite as JCH has posted.
Boreholes are another ‘own goal’ I fear, the ‘standard model’ does encompass SOME warming from land use changes and early industrialisation from the 1800s as seen in the instrumental record. This is supported by Borehole results. This paper from 2001 has a rather prescient last sentence…
Click to access 6d97283dc455e4bea8189c7fe1d5f9e324da.pdf
“Thus the total surface warming in the Northern Hemisphere from preindustrial time to the end of the 20th century may be asmuch as1.1◦C, although it will take some time to see if the extreme warming in the 1990s is sustained.”
But while there is little support for your breakpoint before 1960, there is considerably more for a breakpoint around the 1970s when the rate of warming may have detectably increased. Before you put to many eggs in the borehole you may want to investigate the corrections made to borehole temperature profiles to compensate for ice cover. This confers considerable uncertainty on the timing and resolution of the results.
https://www.clim-past.net/14/559/2018/
” In the northern central Chile region, between 26 and 28◦ S, the data suggest a cooling
from ≈ 1850 to ≈ 1980 followed by a 1.9 K warming starting ≈ 20–40 years BP”
Indeed, “everything should be made as simple as possible, … but no simpler”
We don’t need a metric if we have common sense and reasonable judgement, which is also something scientists need.
@ Ragnaar
Measuring borehole temperature profiles and then performing (nonunique) inversions to extract an integrated signal of past surface temperatures is full of potential pitfalls. The fact that a consistent global estimate of ~1 °C warming (greater in high latitudes) has been obtained is remarkable in itself; don’t try to put too much weight on the details. The original review and analysis used in the AR5 plot is here:
Pollack & Smerdon (2004), Borehole climate reconstructions: Spatial structure and hemispheric averages, GJR Atmospheres
So lots of evasive jabber and no alternative physical explanation of the observations from the scientific evidence deniers.
As Dave G said, game over. You lose.
JCH:
Your Law Dome plot. In 1800 we get the value we also had from 1200 to 1550. You found a plot that might fit the narrative. That since 1600 CO2 levels have risen, causing the upwards break as shown in AR5 figure 5.7.
As far as other plots go, WUWT is over represented in CO2 plots pre-1950.
SkS has one that is neutral:
https://skepticalscience.com/print.php?r=58
Coincidentally the skeptics are also over represented in Law Dome Ice Core plots.
You’d have enslave Siri – she’s available for enforced monogamy – to keep track of the geography of this Minnesota insanity.
“One experiment. More weight than the IPCC report? Double standards, anyone?”
Yes to weight but not necessarily more. In context the skeptics have been hammering on measurements. And I recall criticisms of similar approaches to LC18 as they are easier to do and a lot of people are doing them. The context may be that the IPCC hitched its wagon to GCMs where the rest of us use more familiar metrics. That includes policymakers.
“I validated this when I didn’t know my water bed heater had to work.”
It was really cold. I had a heat lamp shining on the bed and though it was warmer than otherwise, it wasn’t very much so. So in the 1980s, I was experimenting with IR heating water in my apartment.
It’s one of my favorite arguments. Not the water bed one:
“Below the sea surface, historical measurements of temperature are far sparser, and the warming is more gradual, about 0.01°C per decade at 1,000 meters.”
https://scripps.ucsd.edu/news/voyager-how-long-until-ocean-temperature-goes-few-more-degrees
Back of a napkin math, we’re good.
JCH said:
There’s a small vocal group here in Minnesota called Minnesotans For Global Warming (m4gw.com) who are trying to wish or pray for GW cuz they don’t like the cold weather. I seem to recall they put up a huge billboard on the I-94 freeway advertising some ridiculous YouTube video several years ago. Ragnaar must be their accountant.
izen:
Near as I can make out, here’s the argument. You have a stack of science that explains 1950 going forward. Great. Now we could apply that same science to say 1600 going forward to expand our knowledge and create something with value.
To the extent there needs to be the best physical answer explaining post 1950 there also needs to be one for post 1600. So the request is that the rules that hold for now apply to the past.
If they do, it was the CO2 that caused any break if there was one. But the CO2 plots to me back then look like they are wandering.
The past argument was hockey stick or not hockey stick. Hockey stick won. The contention is the break between the shaft and the blade requires throwing gasoline onto the fire and I don’t see it in the CO2 data.
JCH:
Regarding Cortana. We need stop before we get to 700 ppm. Yes, let’s do that.
However, the Panama Isthmus shoaled 24 millions years ago. We might want to throw some of your plot data out.
See how the Eocene data groups into before and after?
Good find.
I used to manage a company that made hot-air balloons. One thing that makes them fly is IR. We had a solar balloon, huge thing, that would self inflate and launch with no fossil fuels at all. Sport balloons require gasoline-powered inflation fans and a liquid propane burner.
One of customers took one to the arctic to fly over the North Pole.
It essentially became a solar balloon. Once it was inflated, the pilot had to constantly vent heat, from the sun, to keep the thing close to the ice. He barely used any propane at all.
Like Ragnaar’s water bed, this has nothing to do with anything:
Been done Ragnaar. You don’t see it because you don’t want to see it and know you won’t like the answer. That doesn’t mean it’s wrong. In fact, given your track record, it introduces a strong Bayesian prior that it’s correct.
Paul Pukite.
They made this funny video:
M4GW Makes Inconvenient Music Video
@-Ragnaar
“To the extent there needs to be the best physical answer explaining post 1950 there also needs to be one for post 1600. So the request is that the rules that hold for now apply to the past.”
They do.
You need a cause to explain an energy imbalance that drives a change in global temperatures.
-CO2
-Volcanoes
-Solar
-Albedo
Can you think of any more ? (ENSO?!)
You also need a credible effective change in temperature/sea level/ice-mass that requires a cause, something you have failed to identify so far.
@-“The contention is the break between the shaft and the blade requires throwing gasoline onto the fire and I don’t see it in the CO2 data.”
I suggest you re-calibrate your graph eyeometer and look harder.
Ragnaar said:
Sure it’s been done (CMIP runs versus GMST) back to 1860. Based on Google searches, sparingly.
A point is the CMIPs whiffed from about 1910 to 1940.
JCH’s link above from Jevrejeva shows the system winding up while the AR plot immediately above shows the CMIPs wandering from 1860 to 1910 and of course is silent prior to that.
The CMIPs show a small increase from 1940 to 1960 while GISTEMP shows a decrease while small, is decades long.
Policymaker expectation one. Get the sign right. We are supposed to be making money, but we are losing money, for two decades.
The IPCC must have screwed up the last of the three plots. Black has to be observations.
Ragnaar,
I’ve slightly lost track of what you’re implying, but we have much more information about the post-1950 period, than we do the pre-1950 period. We could probably finesse the models to match the earlier period, but given the lack of info, our confidence in such a match would not necessarily be very high. Similarly, that they don’t necessarily match that well is not really a good reason to doubt them. There are lots of reasons why a period of a few decades may warm more than expected, or cool more than expected.
Very odd. I’m in Spain, and so I think the system is confused about the time. I posted my previous comment after Dave’s (7:05pm) but it’s ended up appearing before his (as this one may too).
@-Ragnaar
“A point is the CMIPs whiffed from about 1910 to 1940.”
Is the whiff statistically significant ?
The CMIP results are averaged to smooth out short variations when hindcasting IIRC because they do not duplicate the phase of the quasi-periodic ENSO cycle. Perhaps in the future they will do better, if Paul is right.
They are also subject to errors in the input of other forcings, most notably aerosols.
Sea level rise, despite the limitations of early records, may provide a better match with CMIPs.
This all looks rather like the attempts to define a ‘pause’ in the 2000s, or the SKS escalator where people point to one short step down among the ongoing ascent.
“As I was going up the stair
I met a man who wasn’t there!
He wasn’t there again today,
Oh how I wish he’d go away!”
(Mearms)
@-ATTP
“I posted my previous comment after Dave’s (7:05pm) but it’s ended up appearing before his (as this one may too). ”
Mine too.
If this appears above Dave it looks like he gets the last word !
(grin, for now)
Still no alternative explanation for the observations from Ragnaar.
ATTP: You might want to append a reference to the the following to your OP…
Climate Feedback asked its network of scientists to review the article, The Sea Is Rising, but Not Because of Climate Change, Opinion by Fred Singer, The Wall Street Journal, May 15, 2018.
Five scientists* analyzed the article and estimate its overall scientific credibility to be ‘very low’.
A majority of reviewers tagged the article as Biased, Flawed reasoning, Inaccurate, and Misleading
Review Summary
This commentary published by The Wall Street Journal, written by Fred Singer, claims that warming (and therefore greenhouse gas emissions) has no effect on global sea level rise. Although Singer concedes the physical fact that water expands as its temperature increases, he claims that this process must be offset by growth of Antarctic ice sheets.
Scientists who reviewed this opinion piece explained that it is contradicted by a wealth of data and research. Singer bases his conclusion entirely on a cherry-picked comparison of sea level rise 1915-1945 and a single study published in 1990, claiming a lack of accelerating sea level rise despite continued warming. But in fact, modern research utilizing all available data clearly indicates that sea level rise has accelerated, and is unambiguously the result of human-caused global warming.
Since the 1990s for example, satellites have measured an acceleration in the rate of global sea level rise:
Figure – Global mean sea level (blue), after removing an estimate for the impacts of the eruption of Mount Pinatubo (red), and after also removing the influence of El Niño (green), fit with a quadratic (black). From Nerem et al. (2018)
Wall Street Journal commentary grossly misleads readers about science of sea level rise, Edited by Emmanuel M Vincent, Climate Feedback, May 18, 2018
* Benjamin Horton, Professor, Earth Observatory of Singapore; Chris Roberts, Research Scientist, ECMWF/Met Office; Ernst Schrama, Associate Professor, Delft University of Technology; Keven Roy, Research Fellow, Nanyang Technological University; and, Stefan Rahmstorf,
Professor, Potsdam University.
Solar and volcanic aerosols, mostly.
CO2 fell slowly across the Cenozoic, so there’s no need to handwave at ocean gateways (which being rare and discontinuous events would not drive a very long term cooling trend that characterises the Cenozoic).
The gradual change in CO2 forcing is a much more plausible explanation for the slow transition from hothouse to icehouse. See eg. Hansen & Sato (2012) (my bold):
… the IPCC hitched its wagon …
No they didn’t Ragnaar. They looked at lots of stuff. That’s their job. Not to do science. To look at all the science. You should read it sometime. Much more reliable than wherever you’re getting your zombie myths and memes. And science is often unfamiliar. Familiar tells you that heavy stuff falls faster than light stuff, the Earth is flat and the Sun orbits around it.
And what do you have against GCMs? They work very well. A thousand times better than any of the solar stuff, or the cyclic models that always predict cooling just ahead which never arrives. Wherever it wa you read that they don’t, you’ve been suckered by people who lie to you and play you for the fool.
And BTW I wouldn’t trust a pilot to fly me across the Atlantic using napkin math. And I wouldn’t trust the future of the planet to your napkin math.
If you are interested in model runs for the period before 1850, you should search for PMIP instead of CMIP. Paleo Model Intercomparison Project.
BBD says:
“CO2 fell slowly across the Cenozoic,”
Does not imply “The fact that CO2 is the dominant cause of long-term Cenozoic climate trends is obvious in Earth’s energy budget.”
” Instead a substantial global climate forcing is required. The climate forcing must be due to a change of energy coming into the planet or changes within the atmosphere or on the surface that alter the planet’s energy budget.”
Spot on.
– ” Solar luminosity would have caused a modest global warming through the Cenozoic Era.”.
So other factors were at play. One could even handwave at ocean gateways starting ( being rare and discontinuous events] a very long term cooling trend that characterizes the Cenozoic). Along with the other usual suspects.
–
” Continent locations affect Earth’s energy balance, as ocean and continent albedos differ. ”
is at odds with ”
Redistribution of energy in the climate system via changes of atmosphere or ocean dynamics cannot cause such huge climate change.”
Of course they can.
” Cloud and atmosphere shielding limit the effect of surface albedo change (Hansen et al., 2005),” is a total guess to explain things one way.
” In contrast, atmospheric CO2 during the Cenozoic changed from about 1000 ppm in the early Cenozoic (Beerling and Royer, 2011) to as small as 170 ppm during recent ice ages (Luthi et al., 2008). The resulting climate forcing, which can be computed accurately for this CO2 range using formulae in Table 1 of Hansen et al. (2000), exceeds 10 W/m2. CO2 was clearly the dominant climate forcing in the Cenozoic.”
–
Or one could argue that it got colder first and CO2 dropped as more was absorbed in the sea second.
Not “The gradual change in CO2 forcing is a much more plausible explanation for the slow transition from hothouse to icehouse. ”
–
Note for DG. How many hours in a day in the Cenozoic? How many days in a year? How much more active were volcanoes due to the extra stress of the faster spinning earth, higher waves. How well do we understand these natural phenoma and there forcings since we cannot see them now on our “flat earth””.
Jim Steele [sorry for the shudders] has an interesting take on the ground water questions
“Will Advances in Groundwater Science Force a Paradigm Shift in Sea Level Rise Attribution”.
I do not know if he borrowed from my thoughts or vice versa but odds are he knew and knows a lot more about it than I do. One for BBD.
angech, I seriously doubt that Jim Steele (never heard of him before so no shudders) has anything to contribute. You really ought to put in links, but I found it anyway. Anyone who is still wittering on about Munk’s dilemma several years after peer-reviewed papers have appeared in the mainstream literature resolving it is either (a) ignorant of the literature (b) aware of it but not competent to understand it or (c) in denial because politics, religion or sumfin. Or of course all of the above.
I see he does mention some recent literature and the word “assume” appears eight times in his hand-waving attacks on it. I generally find on going to the source of what deniers call “assumptions”, that they’re not assumptions at all but are clearly and well justified. I’ve done it far too often in the past to waste effort doing it eight more times. If he has scientific objections he should submit them to the relevant journals. As a former journal editor, I can tell you that the efforts on his web page page don’t even reach the low bar for sending out to the author for comment. He’d get a “try harder next time” rejection.
A glance at the bottom of the page shows that half of his posts are crackpot conspiracy theories worthy of the tinniest tinfoil-hatter. Way to destroy your credibility in one easy step, dude. Especially when many of them have pre-packaged, well sourced and documented debunking pages on SkS.
My mail delivery is due in about half an hour. I’d get more sense out of a random postie than by reading Steele’s stuff.
BTW there’s a meme in the UK called “Questions To Which The Answer Is No” (h/t John Rentoul). It applies to newspaper headlines in which are either (a) palpably false or (b) Not Even Wrong or (c) just plain silly. For example, any time you see a Daily Mail headline ending in a question mark, it’s safe to assume that the answer is NO. No further thought required.
The answer to Steele’s question is affirmatively no. Which is not to say that better groundwater accounting won’t improve SLR understanding. Just as better temperature measurements, especially spatial distribution will improve AGW understanding. But not in the way Steel wants. It won’t overthrow established science, it will strengthen it.
Extremely well angech. From physics and proxies. For the Cenozoic, not enough to make any difference. If you do back to the Devonian say, ten times as far back, there is some research into the number of days in the year based on daily or tidal and annual proxies. Volcanoes? They varied up and down, by orders of magnitude more than your handwaving could manage. Again measured from proxies. Google LIPs geology. And where this sort of thing matters, it’s included in GCMs (which also include appropriate land/ocean configurations, in case you didn’t know that). Or excluded where sensitivity runs show that they don’t matter. Or if it’s too hard to include, the paper will generally say so and/or use a simplified model to show that it doesn’t matter (if an effect is really tiny, you don’t have to know exactly how tiny it is, just that it;’s really tiny and doesn’t matter)/
Extra stress due to faster spinning earth? Negligible. There’s this thing called gravity holding us down. It’s why we don’t fly off into space. Do the calculation yourself. Google Earth’s past rotation rate or similar. Pick a date in the past. Do the centripetal force calculation for today and then. Do it at the equator for maximum effect. Then find a gravity map and compare your answer to the natural variation today due to density differences in the crust or mantle. Google units conversion from milligals to metres/second. Report back on how many orders of magnitude bigger natural variation is than secular changes in centripetal force. I’m betting it’s in double figures (the exponent, that is).
What higher waves? Why? Where did the flat earth come from? Do you think GCMs are run on a 2D map? Why do you think that? Because results are displayed on projections? That’s just an accommodation to putting it on the page.
Never heard of Jim Steele either. The article is quite confused about what it’s actually talking about. Is it issues concerning Munk’s enigma – the magnitude and constancy of 20th Century SLR -, or is it recent sea level contributions – since 1993 (satellite altimetry-era) or perhaps since 2003 (GRACE-era) -, or is it recent SLR acceleration? There is also a general confusion over timescales.
Some examples:
– While supposedly assessing the thermal expansion assumptions of Gregory et al. 2013, title Twentieth-Century Global-Mean Sea Level Rise: Is the Whole Greater than the Sum of the Parts?, he cites a paper using Argo data from 2004-2013 as a rebuttal. This doesn’t make any sense because the period 2004-2013 is not in the 20th Century. It could make sense if it were assessing questions of recent thermosteric acceleration, but that’s not what Gregory et al. 2013 was about.
– He cites three papers in suggesting that thermosteric contribution is wildly uncertain, but fails to mention that the three papers refer to very different timescales and periods. One is over a very short-term period of 2003-Feb 2008, one over a longer term recent period of 1993-2015, one relates to a longer-term late 20th Century estimate over 1955-2003. There’s no reason why estimates for these different periods should agree.
– In a supposed rebuttal of Gregory et al’s assessment allowing a positive Greenland ice sheet SLR contribution over the 20th Century, Steele points to large rates of warming in the 1920s and 1930s, apparently unaware that those are in the 20th Century. He then points to research indicating stable rates from about 1960 through 1990, apparently unaware that’s what all the estimates used by Gregory et al. show. He then goes off to talk about a slight deceleration in the past couple of years of Greenland mass loss, which is obviously irrelevant to causes of 20th Century SLR. See above concerning the fact that he seems confused about what he’s actually addressing.
Bizarrely, he then concludes that Greenland cannot provide part of the explanation for steady 20th Century SLR. In case you don’t get why that’s bizarre, here’s the simple language summary of Steele’s argument about Greenland contribution over the 20th Century: Rates were likely to be positive in relation to the large warming in the 1920s/30s and rates were zero between 1960-1990, meaning that Greenland SLR contribution was likely to be higher in the first half of the 20th Century than the second. This actually would indeed help to explain Munk’s enigma.
angech
You haven’t understood what is being explained in H&S12. Or you are simply engaging in denialism. Either way, you haven’t addressed the fact that a ~10W/m^2 reduction in CO2 forcing over the last ~50Ma is the best explanation for the generalised cooling trend of the last ~50Ma. Or are we drifting into Sky Dragon territory here?
And discrete events like ocean gateways still don’t drive long term cooling trends.
Dave said:
Not sure what this is in relation to, but changes in angular momentum in the earth’s rotation are important indicators to climate change. It’s likely that more than 90% of the cyclic variations in rotation rate on scales from days to years is due to lunisolar tidal forcing as a give and take in the gravitational forcing between the mutual orbits of the earth, moon and sun.
Wasn’t part of how Mitrovoca solved Munk’s enigma was his inclusions of the plates moving at a different rate than the globe?
Paul, I assumed that what angech was getting at is that Earth’s rotation speed was so different earlier in the Cenozoic that the change in centripetal force was sufficient to materially change the force of gravity at the surface. I don’t believe that for a moment and challenged him to do the maths. I actually still don’t see how that changes GMSL, because that’s a material balance problem, not a gravitational pull problem. Unless Earth spins so fast water flies off into space 😉 .
But I accept it would change Equator-to-Pole water distribution, which might fool you into deducing a GSML change if you have an uneven sample or could not compare apples to oranges. For example because continental configurations were different enough to change the length of shoreline in each latitude band. I’m saying nothing about tides because they’re cyclical. They’re averaged out well before you get to the shortest interval we can resolve in the palaeo record.
JCH, it was more about changing the rheology profile from surface to Core. The inverse of the problem astronomers have when they infer things like the presence of liquid under ice in Jovian or Saturnine moons. I should think that the viscosity of the plates and the sub-continental mantle are so high that any change in modelled coupling between them would take too long to act. I.e. that it would be important, if at all, on millennial rather than decadal timescales. And maybe swamped by convection cells and plumes. It was the coupling between the liquid outer core and the solid mantle that Munk discounted and they included.
A perfect example of Science Moves On for angech to ponder, which also gives me an excuse to re-link to The Relativity of Wrong. Munk had omitted something he thought wasn’t important, which turned out to be important after all. Once it’s been included, the change is an irreversible process because you can only go back to Munk by ignoring something which we now know is important. Thus Science Moves On.
I don’t think climate scientists like Mitrovica and Wada and Reager, etc. really need any of your help in remembering things.
It’s also to good to keep the following in mind…
Quantum Physics May Be Even Spookier Than You Think by Philip Ball, Scientific American, May 21, 2018
It wasn’t quantum spookiness that gave Pruitt’s minions the horrors last week.
It was the frankness of Bridenstine
https://vvattsupwiththat.blogspot.com/2018/05/the-frankness-of-bridenstine.html
“Wasn’t part of how Mitrovoca solved Munk’s enigma was his inclusions of the plates moving at a different rate than the globe?”
Good to remember that the size, shape, and possibly volume of the ocean basins is constantly changing.
@-TE
“Good to remember that the size, shape, and possibly volume of the ocean basins is constantly changing.”
But the volume of the oceans is not; EXCEPT by thermal expansion and additions from land water/ice.
Changing the size, shape, and volume, of the container may alter how far it comes up the side, which is why coastal based tide gauges have to be adjusted.
But it has no effect on measurement of ocean height relative to the centre of gravity as derived from satellite altimetry.
And we would have noticed if any ocean basins were changing volume enough to cause the observed trend.
(Earthquakes)
Reconciling past changes in Earth’s rotation with 20th century global sea-level rise: Resolving Munk’s enigma
It would probably be the Jim Steele who has been posting climate science denial stuff for years at skepticforum.com .
The relationship between average global temperature and the earth’s angular velocity (or via LOD) has been a discussion topic for groups at JPL and at SYRTE for several years now:
Odd that there is little cross-referencing between this ongoing work by Marcus, and what Mitrovica report. The research definitely is related.
Dave_Geologist says:
“I assumed that what angech was getting at is that Earth’s rotation speed was so different earlier in the Cenozoic that the change in centripetal force was sufficient to materially change the force of gravity at the surface. I don’t believe that for a moment and challenged him to do the maths.”
What are you trying to say Dave?
–
Gravity depends on the mass, not the rotation of an object. [quibbles apart]
Gravity is a centripetal force. If an object is closer then the force of gravity would obviously be higher. The effects of a faster rotation speed would change the effects of any force of gravity on the surface and the earth. More frequent water waves and earth waves with more disruption to climate. Higher due to a higher force of gravity if closer.
–
See JCH “Wasn’t part of how Mitrovoca solved Munk’s enigma was his inclusions of the plates moving at a different rate than the globe?” and Paul’s comments.
Note also the complexity of rotation and the reference planes.
The decrease in rotational speed of the earth is in reference to a standard solar year.
So the earth was rotating faster in relation to the sun which meant shorter days and more days in a year and more frequent solar gravity tides in the past
The moon is in a synchronous rotation. The orbit and the rotation aren’t perfectly matched, however. The moon travels around the Earth in an elliptical orbit, a slightly stretched-out circle. When the moon is closest to Earth, its rotation is slower than its journey through space, allowing observers to see an additional 8 degrees on the eastern side. When the moon is farthest, the rotation is faster, so an additional 8 degrees are visible on the western side.
I do not know if this has always been the case [help ATTP]. The earth was spinning faster in relation to the moon as well and was closer to the moon in the past. The moon has the greater force of gravity compared to the sun anyway. Lunar force of gravity effects would have been both faster and bigger sea and earth waves in the past.
Read the paper Eddie. It’s open access and only five pages excluding references.
Oh, and granny already knows how to suck eggs. She doesn’t need your advice.
Bridenstine: just what we need in a science administrator, a graduate of Rice University with majors in Economics, Psychology and Business, and an MBA. I’ll bet he fills teeth, repairs cars and designs nuclear power stations too. Still, at least he noticed that the pause is over. Time will tell if the rest was lip service. And good luck with predicting specific tornadoes. That’s a thousand times harder than projecting 2100 temperatures for a given RCP. For clarity, to avoid a definitional diversion, I mean here predicting date, place, time and wind speeds. Not “there will be twice as many by 2100”, “they’ll be 20% more powerful”, “they’re twice as likely at a particular stage in the lunisolar cycle”, or other probabilistic predictions.
D_G said ” I don’t believe that for a moment and challenged him to do the maths.”
Lots of obfuscatory bluster from angech, but no maths whatsoever, which means that his proposed physical mechanism cannot explain the magnitude of the observed effect (which was the original challenge that he has ducked). The usual B.S.
I should have thought it was obvious angech. Since this is a thread about sea level rise, I assumed that your rotation rate/hours per day comment was an implication that it needed to be accounted for in considering past SLR. That the change in earth’s rotation rate in the last few tens of millions of years has a gravitational impact sufficiently large that it can’t be safely ignored when considering sea level variation over that timespan. Assuming of course that it was ignored. All the information required to do the calculation is publicly available. If you disagree, do the maths and prove I’m wrong. If that was not your point, explain how you think rotation rate and hours per day bears on SLR.
BTW, some education for you on terminology:
Of course, that angels-on-pinheads quibble would not have stopped you doing the calculation, since it’s only a sign change according to the frame of reference.
I know that. I was referring to the acceleration experienced at surface by a gravimeter, not Big G. The clue was in the reminder to convert m/s² to milligals. Done your homework yet? Here’s a starter:
Do you weigh differently at the North Pole than what you do at the equator?
At the present day, the pole-to-equator difference is 3.39cm/s² or 0.35%. Surface gravity anomalies (primarily driven by geology) range from −364 to +670 mGal. 3.39 cm/s² is 3390 milligal. So centrifugal/centripetal force is about an order of magnitude bigger than geological anomalies. But that’s smooth over 10,000km. Geological anomalies of tens of mgals routinely occur over tens of km. So locally, geological variation is hundreds to thousands of times bigger than centripetal force variation.
Oh, and you also have to account for the Earth not being a perfect sphere. That’s about 600 mgal, but only abut ±3 mgal pole to equator.
But back to rotation rate. You can find good enough numbers on Wiki. As an incentive, I was overstepping the mark when I guessed ten orders of magnitude. I was wrong about that. As an incentive to do the calculation yourself, you’ll be able to point out my error and claim a genuine, if small and irrelevant, victory.
And what do water waves and earth waves have to do with SLR (and what do you mean by “earth waves”)? Is that just goalpost-shifting?
And see my replies to JCH and Paul.
And angech, what on earth does your subsequent post have to do with anything climatic, let alone sea level? Do you really think the professionals don’t know this stuff, and include it when it matters, exclude it when it doesn’t. Really?
Jim Steele (Linkedin)
Biologist, Educator and Author
San Francisco Bay AreaEnvironmental Services
Previous
San Francisco State University, Raoul Wallenberg, international School
Education
San Francisco State University
Here is an article with comments on his Linkedin pages ….
https://www.linkedin.com/pulse/97-climate-consensus-fake-news-jim-steele?articleId=6350109620551450624#comments-6350109620551450624&trk=prof-post
I exchanged posts with him some years ago on PhysOrg.
Munk is sea level genius – the Einstein of the oceans, but he could not solve Munk’s enigma.
Mitrovica solved Munk’s enigma, but is a dumb climate scientist who needs to have his hand held by skeptics.
It’s just too hilarious. The Climate Audit Effect. What has CA actually ever done? Nothing. The only houses the big bad wolf can blow down are the ones made of straw.
Personally, if I don’t understand a figure in a scientific publication as exhaustively peer-reviewed as AR5, I read the caption. You seem to take a different approach.
Figure TS.9 | Three observational estimates of global mean surface temperature (black lines) from the Hadley Centre/Climatic Research Unit gridded surface temperature data set 4 (HadCRUT4), Goddard Institute for Space Studies Surface Temperature Analysis (GISTEMP), and Merged Land–Ocean Surface Temperature Analysis (MLOST), compared to model simulations (CMIP3 models— thin blue lines and CMIP5 models—thin yellow lines) with anthropogenic and natural forcings (a), natural forcings only (b) and greenhouse gas forcing only (c).
@ Dave_Geologist
Where some posters are concerned, it’s worth recalling that it takes a couple of orders of magnitude more work to refute BS than it does to generate it.
Jim Steele is a crank. He is another manufactured ‘expert’ that denier blogs turn to on everything from the effects of warming on coral reef bleaching to pathogenic spread in moose. Most importantly, he isn’t an expert in any of the areas he is quoted on. His publication record is abominable.
+1
Munk’s 2002 enigma paper: http://www.pnas.org/content/99/10/6550
Mitrovic and colleagues’ 2015 response: http://advances.sciencemag.org/content/1/11/e1500679
Both open-access papers, both showing the amount of work and depth of knowledge required to properly recognize, ask, and answer such questions. Of course climate change contrarians complain that the peer-review system is ‘biased’ against them rather than considering that their own lazy incompetence and inability may be at fault.
Dave
“BTW, some education for you on terminology:
“The difference between centripetal and centrifugal force has to do with different ‘frames of reference,’ that is, different viewpoints from which you measure something,” . If you are observing a rotating system from the outside, you see an inward centripetal force acting to constrain the rotating body to a circular path. However, if you are part of the rotating system, you experience an apparent centrifugal force pushing you away from the center of the circle, even though what you are actually feeling is the inward centripetal force that is keeping you from literally going off on a tangent. ”
One tangent here is a previous comment of yours on this or recent thread on flat earths and the sun revolving around the earth, which you knocked. I hope you appreciate that there is a frame of reference where the sun indeed does rotate around the earth though, as you meant, it is not the commonly used one now.
The point about the faster rotation was that there may be an effect on the sea level as some people have alluded to here. In essence more water might go to the poles?? leading to an apparent sea level change at the equator land levels which Izen might appreciate. In other words the shape of the container made by gravity and rotation is different enough to change the concept of sea level even though the volume is the same?
Sorry, tired, have to go to bed.
Hope the argument has some reality and that people confirm it as a thought process not a skeptic line.
Ragnaar wrote “The IPCC must have screwed up the last of the three plots. Black has to be observations.”
That is either weapons-grade hubris or rather subtle humour. If the later, please use a ‘ ;o) ‘ for the benefit of the not-so-subtle reader, such as me! ;o)
angech,
I’m not sure what point you’re trying to make, but the Earth is actually spinning down due to the tidal influence of the Moon.
angech wrote “Hope the argument has some reality and that people confirm it as a thought process not a skeptic line.”
In a scientific discussion the onus is on you to determine whether your arguments are plausible before you make them, rather then setting them up in the hopes that nobody can shoot them down, which I would regard as bullshitting (do read that essay, if you have not already).
Making arguments without first determining their plausibility falls pretty squarely into that definition IMHO.
When you wake up angech, do the calculation and tell us whether the effect is putatively big enough sine the Cainozoic.
Then find, say, an Eocene SLR, see what maps they use and where their observations are. Tell us whether it has an uneven pole-to-equator distribution that’s big enough to bias the sample. Don’f forget to look at the Supplementary Material and check whether they already considered that and either incorporated it, or showed it was too small to bother.
This was considered lunar folklore until someone started looking at the data:
Wehr, Thomas A. “Bipolar mood cycles and lunar tidal cycles.” Molecular psychiatry 23.4 (2018): 923. https://www.nature.com/articles/mp2016263
Dave said:
I can’t parse anything that angech writes but this “big enough” argument is often hard to gauge. Consider any of the large-scale differential effects that are always plausible because the differential can be made arbitrarily small. The effect that Walter Munk and others found long ago to be super-sensitive is the magnified “effective gravity” that is found to occur between density-stratified layers such as occurs at the thermocline.
If somebody asks what it takes to get such a layer moving, the answer is somewhat paradoxical (if not enigmatic) in that the smaller the density difference the less force it will take. So you can almost always calculate a plausible forcing that would register a response if the differential is assumed small enough.
=> What About Gravity? WSJ Readers Respond to Denialist Pseudoscience
I’m not saying small forcings can’t cause large changes Paul. But in deference to the blog title, I want angech to give me a physical justification why the gradual spin-down of Earth’s rotation is one of those things. Specifically in relation to GMSL, so he can’t continue his Gish Gallop into waves and climate disruption. Is the pencil balanced on its tip or lying on its side? In the case of the thermocline, presumably there is huge potential energy embedded in a gravitational instability. The physics of what goes when and where may be difficult or chaotic, but is both intuitively and numerically comprehensible.
What is the equivalent physics for earth’s rotation rate and GMSL? Is it mediated by ice melt/snowfall or by redistribution of the existing water? If the former, what is the mechanism? A butterfly’s wing flips a tropical storm which flips wind patterns which flips ocean currents which leads to big changes in snowfall or ice melt? Note that we’re not talking here about an NAO-sized event – not enough GMSL impact. We’d need something like shutdown of the entire Atlantic conveyor. Not a priori impossible perhaps, but we have observations. We’d have noticed. It didn’t happen. If it’s water redistribution, it can only work through sample bias. We know the sample locations and the continental configurations. I’n saying “demonstrate the bias angech, don’t just say there might be some”.
This is an old reference, but GCMs (very simplified in this case – was 1979, which proves GCMs existed before the IPCC 😉 ) have been spun up to five times faster and five times slower than today. Big differences but of degree rather than kind (e.g. see the lapse rates in Fig. 11).
The only balanced-on-its-tip situation I can think of is the Snowball Earth era about 600 million years ago. Geologists always struggled to explain the repeated rapid transitions from global ice sheets to global sub-tropical conditions and vice versa. Hunt had a go at that too, but he could only use rotation to explain a one-off glacial-to-non-glacial transition. With better dating and correlation we now know there were multiple rapid transitions, hot-to-cold and cold-to-hot. Unless rotation was speeding up and slowing down, it doesn’t work. You could do something wacky using angular momentum exchange with the Moon in a chaotic orbit, but even then I suspect spin-up and spin-down would be too slow. Plus you’d need to show that the orbital physics works. But there’s no need. GCMs can explain it using reasonable parameters for that geological time. Global temperature has a bifurcation, where an icehouse world and a greenhouse world can exist at the same atmospheric CO2 content but with hugely different albedos. It needed the right combination of solar, orbital, rotational and other parameters to put Earth in that bistable state. That particular configuration doesn’t exist any more due to the warmer sun, and may never exist again (you’d have to get CO2 down really, really low).
Without a physical mechanism, it’s all unicorns to me.
I meant to add, I have no objection to Earth’s rotation rate being a candidate forcing to flip the bistable snowball/greenhouse earth. Although probably only in the deglaciations, unless you can propose a spin-up mechanism. Back then, the pencil was balanced on its tip.
Another reason to think we’re not in that situation now is the geological record. The Past is the key to the Present, if you like. In the late Precambrian, when conditions were right, the switch did flip, multiple times. If we’re again or still in an unstable or bistable condition, which did it not flip in past glaciations/deglaciations? The Earth has been gradually spinning down all the way since Snowball Earth times. And why would it choose to flip during this one, just when we happen to be pumping out GHGs? Occam’s Razor applies.
WHT –
My condolences on the passing of Art Bell.
ave said:
I’m not interested in discussing anything directly with ange as he or she appears to be a larikin. Yet, I am always interesting in discussing physics with people like you that have obvious expertise in the subject matter.
That’s a good one, because the feedback of CO2 on H2O is positive.
Other ones:
1. Atmospheric convection is a balanced on its tip situation. It can build up until it flips
2. Lake and ocean overturning is a balanced on its tip situation. Same thing and it happens seasonally
3. Equatorial phenomena are a balanced on its tip situation because the Coriolis forces cancel out to zero there.
4. The excess mass of water in the western Pacific is a balanced on its tip situation. Any disturbance can cause it to slosh back.
These aren’t runaway situations though, just metastable.
I don’t disagree with any of them Paul. Although if you’re implying that the snowball/greenhouse earth is a runaway, I would disagree (but I’ve been dragged into terminological arguments before 😦 ). For me a runaway would be a feedback factor greater than 1. In the bistable Proterozoic climate concept, neither branch is a runaway. However each can reach a metastable end point where it flips to the other branch. A runaway would be if the cold branch ran away to the left forever, or the hot branch ran away to the right forever. See the image blow from some quick googling. In this diagram the solar constant is varied, but you could equally do it with fixed solar constant and varying CO2
For clarity, when I said Snowball Earth was the only balanced-on-it-tip situation, I didn’t mean in general. I meant in the context of turning a large volume of ice into water or vice versa, quickly.
More sloppy language 😦 . I should have said: a runaway would be if at some point the cold branch ran off the bottom of the graph at fixed solar constant, or the hot branch ran off the top of the graph at fixed solar constant.
I wrote a post a while ago that might be relevant.
Thanks ATTP. Cool!
So If we had gone into a Snowball during one of the 200ppm glacial lows, we could have been stuck in it. But we wouldn’t have had to wait for 110% solar irradiance, because we’d have got out the old-fashioned way: CO2 buildup from volcanoes, with no land weathering or ocean absorption to draw it down.
I was thinking yesterday of this paper. Probably aimed a bit more at a realistic Earth, but 15 years old so limited by computer capacity in what they could do.
It’s open access so I’ll try to directly link Fig. 6, which has CO2 and irradiance scales. I presume if you read off one scale, you should assume that the other is fixed at present-day values. You need a hefty 0.2bar pCO2 to get out of a Snowball. That would be a long wait. But to get into one you need to drop pCO2 to 15 microbars. Reassuringly infeasible. No global Day After Tomorrow.
With a Late Proterozoic solar flux, you were close to the Snowball bifurcation. If ice sheets got within 30° of the equator, you’d flip into a Snowball and need a lot of CO2 addition to get back out. When you did, you’d flip to ice-free. This model is tristable, with a polar-ice to ice-free bifurcation, but that unstable range is very small in CO2 or flux space so i imagine it wouldn’t take much parameter tweaking to turn it into a smooth transition. Although I do quite like the idea that we’re close to that bifurcation. It might explain why we have long periods without Ice Ages then flip into an Ice Age for a while, then flip back out (I’m talking about the whole Phanerozoic here, not glacials/interglacials).
So maybe a butterfly wing could make a difference after all. That’s not good news angech. It might give you a small, accidental (because I’m the one who found the paper, not you), Pyrrhic victory. Why Pyrrhic? Because it would mean that catastrophic AGW is a Real Thing. We’d be on the lower, polar-ice branch, close to the upper, ice-free branch. It would mean that when we cross some threshold CO2 ppm, all the ice would melt, and stay melted even if we drew CO2 down below pre-Industrial levels. Probably until we’d drawn it down well below Quaternary glacial levels. Quite possibly, we’d have been responsible as a race for the Earth’s last glaciation ever. Not just for postponing the next glacial of the current Ice Age. And people are arguing about whether the Anthropocene is a Thing?
Dave said:
You’re right. It’s a runaway of a mild positive feedback until it hits the snowball-earth set-point of ~255K. Most runaway situations end in some sort of set-point where another (negative) feedback stops it. Curiously, I have never seen the following straightforward derivation used to calculate a thermodynamic set-point anywhere in the climate science literature:
http://theoilconundrum.blogspot.com/2013/03/climate-sensitivity-and-33c-discrepancy.html .
Here is the graphical equivalent of the set-point result showing the 2 operational set-points of 255K and 289K, thus demonstrating the 33K discrepancy between the two set-points.
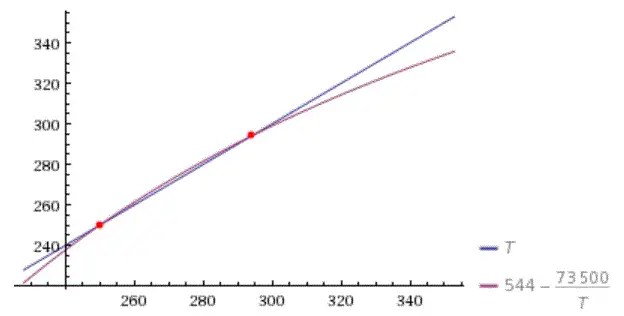
Magma:
The question is, what is panel 3 above of AR5’s FigTS-9.
“…anthropogenic and natural forcings (a), natural forcings only (b) and greenhouse gas forcing only (c).”
From: http://www.climatechange2013.org/images/figures/WGI_AR5_Fig10-5.jpg
NAT is zero.
GHG is 0.9 C.
Panel (a) is 1.0 C, close enough.
Panel (c) is 1.3 C. That is GHG, it says so.
Panels (b) and (c)’s redlines bracket panel (a)’s redline. They should add to it, not average to it as shown. The very fact they are averaged implies what about the weight of each?
When NAT centers around zero, it’s not kind of zero or zero when we want it to really be zero. It’s zero. It did nothing means, it did nothing.
So panel 3 of still doesn’t make sense to me and what does it mean to a policymaker who kisses babies for a living?
We could say that I picked about 1950 going forward and FigTS-9 is a longer time frame. A longer time frame where everything lined up around 1950 anyways. Which goes along with the signal emergence at that time story.
So we had at least 10 scientists with IPCC decoder rings working on this specific plot. Any idea what they were trying to say?
Could you try that again please Ragnaar, but this time aiming for reader comprehension. And not linking to embedded figures with no captions. Much better to link to report and quote figure # in text. then we can perhaps see the context. For example, the figure you linked to doesn’t have a Panel 3. Not even a decoder ring would help with that.
Ragnaar,
I think you have to be slightly careful since NAT in that figure is natural forcings (volcanoes, Sun) and Int is internal variability. Over that time period we’re pretty confident that the net change in natural forcings was close to 0 (with some uncertainty that is shown in the figure).
I think I see now where you’re coming from with runaway feedback Paul. I was being too mathematically literal. On the stable branches there is no runaway feedback. Just positive feedback with a gain less than 1. There is theoretically no runaway feedback in the state change either. You jump instantaneously across a forbidden parameter space. But in the real world you can’t instantaneously melt gigatonnes of ice or freeze gigatonnes of water. During that special transition period you do have runaway positive feedback. Adding 100 sq km of ice changes the albedo enough to freeze more than 100 sq km of sea. Very quickly.
I’ve always had an interest in the Proterozoic glaciations because some of the classic outcrops are close to home in Scotland. They go into and out of the Snowball in a geological instant. The cap carbonates are laid down directly on glacial deposits. Glacial dropstones landed on mud from tropical seas which was still soft. It’s almost unique in earth history. More sudden than any mass extinction bar the K/T. Prior to bifurcation models I couldn’t understand how it happened. Yes explanations were attempted, and may have convinced climatologists 🙂 , but to me as a geologist they all seemed contrived, hand-waving or special pleading. Suddenly it all fell into place.
ATTP:
We can agree that NAT was close to zero. If we use this:
then we wonder about the error bars as percentage. Whatever they are, those rolled into the 110% attribution as explained by Schmidt (Reply to Curry 50 50). So saying that ANT and NAT are about zero leaves GHGs. And the difference between GHGs and zero is GHGs. This:
suggests that zero plus GHG is an average, perhaps weighted, of the GHGs and NAT. This suggestion is partly visual. In panel (a), the two redlines of panels (b) and (c) converge to (a)’s redline.
We may argue that visual is not scientific, yet the IPCC chose to portray the situation as such. In a portrayal this idea is to get the essence of what’s going on. It is using a communication tool that probably leads to spending money.
Why would I want to tie two things that may or may not be related or agree with each other, or had some other point besides agreeing and reconciling to the other numbers?
In accounting, everything ties all the time to everything else without exception. When that is not true, you have a problem and the resolution of that problem can be messy to put it mildly.
I believe my original statement was maybe the IPCC screwed up panel 3 which is properly called (c).
One could argue the missing thing in the 3 panels is OA which is -0.2 C. Not enough. Look at (c) and drop it down 0.2 C. Still not enough plus the crime of an overstatement. Never overstate net worth or income. And the redline is portrayed as something, our pride and joys, the CMIP5s. We would those be off by 0.2 when the whole shooting match is about 1.0 C?
Ragnaar,
I don’t follow what you’re suggesting. We have an observed temperature change (with an uncertainty) and we have a set of things that can cause surface temperatures to change (ANT, INT, NAT) all also with uncertainties. When you combine these you find that the best estimate is that ANT (by itself) would have caused more warming than was observed, and hence that ANT and INT were probably responsible for some cooling.
Here is the caption for Figure 10.5 that Ragnaar has embedded in previous comments.
Figure 10.5 | Assessed likely ranges (whiskers) and their mid-points (bars) for attributable warming trends over the 1951–2010 period due to well-mixed greenhouse gases, other
anthropogenic forcings (OA), natural forcings (NAT), combined anthropogenic forcings (ANT) and internal variability. The Hadley Centre/Climatic Research Unit gridded surface
temperature data set 4 (HadCRUT4) observations are shown in black with the 5 to 95% uncertainty range due to observational uncertainty in this record (Morice et al., 2012).
If Raganaar were really interested in understanding this figure better, he would read the paper that it comes from, i.e., Morice et al., 2012.
Dave said:
Yes, there is the path involved in getting from one set-point to another, which is what I was describing. But then once the system reaches the other set-point, a phase transition can happen that helps to lock it in place. To get the process to reverse, an extra latent energy barrier may need to be surmounted.
Raganaar says:
“So saying that ANT and NAT are about zero leaves GHGs.”
I can’t make sense of this statement. Who is saying ANT is zero and why would anyone say this?
Joshua said:
I knew who that was but never followed his show. Bell wasn’t a skeptic of the paranormal as much as a fan of the paranormal.
If a connection was brought on by my mention of the bipolar-mood/lunar correlation, remember that that article was in a Nature journal and was written by someone at the NIMH in Bethesda.
Paul –
Wasn’t it you who compared Judy’s “denizens” to callers on that show?
Easy enough to check that I once said in response to someone that asked who Art Bell was:
OK, there is some comparison to be made between Art Bell and Judith Curry.
It’s easy to see why kooks would be attracted to a show about paranormal activities (i.e. Art Bell), but it really was a new thing when we all found out that there was a similar kind of base readership to a blog that’s ostensibly about the physics of fluid dynamics, etc (Judith Curry). The facade she has played up that that these problems are too hard to solve and that uncertainty rules, which seems to attract reactionaries. But the facade has started to unravel as Curry is pushing her company for its outstanding weather forecasts.
I can see the connection to calls to draining the swamp, while simultaneously inhabiting it.
I was thinking of something like this:
Joshua, the sad fact is that pseudo-science and paranormal discussions had been a radio staple for years. But as radio fades away, it was inevitable that the new generation will go to social media and sites like WUWT to get their fix.
Ragnaar, ATTP,
Figure 9 is the product of three separate sets of AOGCM modelling runs (a), (b) and (c). If the system was perfectly linear, then you could use linear superpositioning (e. g. (a) = (b) + (c)). The system is not exactly perfectly linear, but it is reasonably close, say O(0.1). You can use linear superpositioning, but if the system as a whole in not exactly perfectly linear, then I don’t expect (a) ≡ (b) + (c). It is reasonably close (e. g. O(0.1) but it is not exact.
Great thread, J.
I notice there was an adult in that room:
I foolishly clicked the link Willard. How do you manage it? You must have the tolerance of a saint.
Lies, lies and misunderstandings. You ask them to back it up with a cite. They think adding another unsubstantiated (no doubt false) claim counts as a cite and claim victory. Rather you then me. I’d be banned within a month.
Paul I don’t see the difficulty in getting out of a snowball as being due to latent heat (presumably that required to melt the ice). The Proterozoic Earth also got out of the Snowball in a geological instant. The latent heat means it was not an instantaneous jump to ice free, and it was slow by the standards of our lifetimes, but still miniscule compared to the time spent in the snowball state. Latent heat only matters during the state change. It’s the albedo of an ice-covered earth which which keeps us there for millions of years, even while CO2 rises. Latent heat only makes the escape take thousands of years, rather than happening overnight.
Latent heat and albedo changes are the same category of hysteretic behaviors that explain your graphs of May 24, 2018. What I was describing with the CO2-assisted positive feedback H2O outgassing does not require that mode.
RE: Jamal Munshi’s “paper” (e. g. SSRN papers)
ATTP sez “Strange that Munshi would delete those tweets.”
Actually it’s SOP, Munshi posts at JC’s and WTFUWT (e. g.) …
… and all of his ‘so called’ papers are located here …
https://papers.ssrn.com/sol3/cf_dev/AbsByAuth.cfm?per_id=2220942
77 SSRN papers and AFAIK not a single one has been formally published in any peer reviewed literature (SSRN ‘papers’ sorted in time descending order). Roughly 60 of those ‘papers’ are climate science related (very roughly the 60 most recent).
Google Scholar indexes SSRN ‘papers’ and Munshi’s ‘papers’ always show up in referenced paper lists for any reasonably high profile climate science paper (e. g. Hansen’s “Ice melt ,,, ” paper). So that is his (and others) main MO, cite real climate science papers with high (or likely to be high) reference counts.
In other words, Munshi is a full tilt boogie climate science denier and has gone emeritus to boot.
Note to self: I do w-a-a-a-a-a-y too many Google and Google Scholar searches.
Interesting pattern in Jamal Munshi’s approach. He looks for time-series studies across various disciplines and then does a statistical analysis on them. A paper describing the results will be archived on SSRN to either show statistical significance against some trend, or not, depending on his political agenda. He does that over and over.
Yes, we get the fact that a quasi-monotonic trend is ripe for finding spurious correlations. But Munshi’s studies do little to rule anything out. They exist only to feed the uncertainty monster.
We’ll have to agree to disagree on the terminology Paul (I’m being literal again; latent heat is a very specific property, not a bucket term for any hysteretic influence on warming rate), but at least we’re in the same place on the physics.
aTTP:
Above I made material and substantial mistakes reading and commenting on the above AR5 Fig10-5 and AR5 FigTS-9 I referred to. My indicating that the various plots did not balance out and did not support each other was not and is not true. They do support each other. I figured out I was wrong by looking at the situation some more. I am sorry if I caused problems with my recent comments.
Ragnaar,
There’s no need to apologise for acknowledging an error/mistake. I make many myself.
How much more h2o is the air hold in the form of humidity? How or will this affect sea level rise etc. Just seems like a warmer enviroment will have a higher water to vapor exchange.
As a curiousity. Do any calculations exist for the water capcitance of animals? Like the bison or humans? Every human is holding a significant volume of water times billions equals some less than trivial amount doesn’t it?
Robert,
According to this 96.5% of the water on the Earth is in the oceans, and 2.5% is freshwater. Of the freshwater, 3% is in the atmosphere and 0.26% is in living things. So much of the water is in the oceans that the rest just seems negligible. Adding water vapour to the atmosphere, or to living things is not going to impact something like sea level rise.