
The Imperial College code, the results from which are thought to have changed the UK government’s coronavirus policy, has been available for a while now on github. Since being made available, it’s received criticism from some quarters, as discussed by Stoat in this post. The main criticism seems to be that if you run the model twice, you don’t get exactly repeatable results.
As Stoat, points out, this could simply be due to parallelisation; when you repeat a simulation the processors won’t necessarily return their results in the same order as before. However, it could also be due to other factors, like not quite using the same random number seed. These simulations are intended to be stochastic. The code uses random numbers to represent the probability of an outcome given some event (for example, a susceptible person contracting the virus if encountering an infected person). Different runs won’t produce precisely the same results, but the general picture should be roughly the same (just like the difference between weather and climate in GCMs).
For a while now I’ve been playing around with the Imperial College code. I should be clear that I’m not an epidemiologist and I haven’t delved into the details of the code. All I’ve been doing is seeing if I can largely reproduce the results they presented in the first paper. The paper gives much more detail about the code than I intend to reproduce here. However, it is an individual-based model in which individuals reside in areas defined by high-resolution population density data. Census data were used to define the age and household distribution size, and contacts with other individuals in the population are made within the household, at school, in the workplace and in the wider community.
 I’ve run a whole suite of simulations, the results of which are shown on the right. It shows the critical care beds, per 100000 of the population, occupied under different scenarios. If you’ve downloaded the paper, you should see that this largely reproduces their Figure 2, although I did have to adjust some of the parameters to get a reasonable match. The different scenarios are Do nothing, Case Isolation (CI), Case Isolation plus Household Quarantine (CI + HQ), Case Isolation, Household Quarantine plus Social Distancing of the over 70s (CI + HQ + SD70), and Place Closures (PC). To give a sense of the severity, the UK has just under 10 ICU beds per 100000 of population.
I’ve also included (dashed line) the scenario where you impose Case Isolation, Place Closure (Schools and Universities) and general Social Distancing for 150 days (which they show in their Figure 3). As you can see, this really suppresses the infection initially, but there is a large second peak when the interventions are lifted. This is what, of course, is concerning people at the moment; will the lifting of the lockdown in some parts of the UK lead to a second wave?
So, I seem to be able to largely reproduced what they presented in the paper. This doesn’t really say anything about the whether or not the results are reasonable respresentations of what might have been expected, but it’s a reasonable basic test. I will add, though, that there are a large number of parameters and I can’t quite work out how to implement the somewhat more dynamic intervention strategies.
Something else I wanted to add is that I’ve also played around with some other codes, including a simple SIR code, a SEIR code, and one that included an age distribution and a contact matrix. Whatever you might think of the Imperial College code, all of the models seem to suggest that without some kind substantive intervention, we would have overrun the health service.

Um…we did over-run the health service. Unless you think that refusing to treat a huge number of ill people was just for fun?
Fair point. Poorly phrased on my part. I was simply trying to stress that whether you trust the Imperial College code, or not, there is little to indicate that we over-reacted.
> Unless you think that refusing to treat a huge number of ill people was just for fun?
You might also consider a shortage of PPE as a measure of being overrun.
Any way you slice it, the World will not drop below 1000 deaths/day in 2020 …

World = World – CN = EU + US + RoW
RoW = World – CN – EU – US
SA = South America
RHS = x-axis log scale divisions are 30, 60, 90 and 120-days
A 2nd wave in the fall will make the time series look like a double humped camel with a global saddle point above 1000 deaths/day. That is the best prognostication that I can make as of today.
I forgot to mention that those time series are 7-day rolling means. Done so to remove the so-called weekend effects (which is real).
I dug into this non-determinism issue being raised to discredit the model.
First of all, in regard to getting two different results in single-processing mode, it was a bug introduced by the MicroSoft team. There’s really no reason to believe it exists in the original version of the model used by IC to generate the earlier projections used by government.
As so often happens, this bug was introduced when a new feature was added. Generating the network of individuals, households, etc is time consuming, and the developers decided to introduce the option of generating and saving a network without running the simulation, then in the future loading the simulation. This resulted in the pseudo-random number generator being seeded twice. If you generated and then simulated the network in one run, the seeding was only done once. Different results. Hmmm. BUT once saved, every time you run the simulation on the same network you get the same results using the same seed. The developers had never compared the generate-save-restart-load-simulate workflow with the generate-simulate workflow and hadn’t noticed the two scenarios gave different results with the same seed. It was fixed two days after it was reported and diagnosed, but the fallout has not died.
Now, regarding the multi-processing case, given the expense of network generation they don’t serialize the processes to guarantee that each time it is run, individuals are assigned to the exact same households or schools. The assignments do follow the parameter values used to drive the algorithm, so the statistical distribution does fit those. The developers state this is intentional because the time savings is more important to them than guaranteeing reproducibility – after all, you can save a network and then rerun using that same network to your heart’s content (regression testing, debugging, etc).
When run in multi-processing mode they guarantee reproducibility when you simulate the same network with the same number of threads. Again, important for regression testing etc.
Now, I can think of two possibilities here:
1. The developers from MicroSoft who are working on it haven’t actually tested reproducibility under the conditions where they guarantee it and are lying about the fact that they have and, indeed, depend on it. I’ve found no evidence for this.
2. lockdownsceptic doesn’t know what he’s talking about. Having read his commentary, I’ll say this is definitely true in some cases, at least.
dhogaza,
Thanks, that is very useful.
https://twitter.com/nevaudit/status/1258287467133677570
Has anyone read Tommaso Dorigo’s post, starting out:
“First off, let me say I do not wish to sound disrespectful to anybody here, leave alone my colleagues, to most of which goes my full esteem and respect (yes, not all of them, doh). Yet, I feel compelled to write today about a sociological datum I have paid attention to …”
Keith,
No, I haven’t read that. I’m not even sure of the context Do you have a link?
Google search
https://www.science20.com/tommaso_dorigo/the_virus_that_turns_physicists_into_crackpots-246490
Joshua,
Thanks. I think that article makes some pretty good points.
Yup.
With respect to comparing the effects of a “lockdown” in one country to voluntary social distancing in another, (or, I might add, extrapolating a national fatality rate from an infection rate in a non-random sample from one locality that isn’t nationally representative on such basic metrics such as SES and race/ethnicity) ::
>… I saw curves describing data from one country overlaid with other curves describing data from other countries, shifted according to ad-hoc criteria;…
Willard
Actually there really was a bug, as I described above. lockdownsceptic clearly didn’t understand what the bug is when he jumped on it, nor the fact that it had been recently introduced along with the new feature I described, and ignored the fact that it was fixed two days after being diagnosed with the help of the team that reported it. Or that the development team hadn’t noticed because the way they configured and ran the model DID lead to deterministic (reproducible) results. Blah blah.
It’s just FUD, though. It’s the same strategy used to try to discredit models like the NASA GISS Model E. Scream for them to be open sourced. Then scream “the code is unreadable (I don’t think Model E is, though the physics is incomprehensible 🙂 )”, OMIGOD it is written in FORTRAN it must suck!!! etc etc.
Of course everything thus far is unrelated to the MODEL part of the model source code, i.e. the parts that implement the SIR model that moves people through various states, the parts that model the geographic spreading of the disease, the parts that model the pace of infection through households and schools and all that. The parts that correspond to Ferguson’s paper describing how the model works. It’s much easier to say “your variable names suck!” than to address issues of substance.
> OMIGOD it is written in FORTRAN it must suck
Jinx:
https://twitter.com/nevaudit/status/1258554550128173056
If you read back the thread you’ll notice auditors who fail to realize that R (which is as ugly as it can get imo) is a bit newer than they presume.
Requiring bit-level reproducibility for stochastic simulation is a bit unreasonable – in most cases we ought to be more interested in whether the stochastic variability from run-to-run is suitably small that we can place reasonable confidence in any given run.
I did an experiment a few years ago that was basically a low-priority job that could be run when there wasn’t something more important to be done, and it ended up taking a N months to generate the results. The individual simulations took longer than the maximum allowed on the cluster (@5 days), so I designed the system to checkpoint, including saving the state of the random number generators, so in principle it would be possible to re-run all the simulaiions again and get the same numeric answer (I’m not naive enough to think that would hold in practice). This ended up taking quite a bit of work to get just right. But then it occured to me it would be an egregious waste of computer time to re-run all of these simulations for another few months, so what was the point in aiming for bit-level reproducibility for a study that would never be replicated (because of the cost and because stochastic reproducibility would have been acceptable for all practical purposes)?
There is some irony in people preferring R to Fortran as programming languages – they are both fairly horrible in their own peculiar fashions! ;o)
(They both have their uses though)
It was also amusing in that twitter thread some were also suggesting MATLAB as better than Fortran, despite MATLAB (especially back in the 90s) was mostly a front end for a set of highly efficient and reliable library routines written in, errr, Fortran (with some nice graphics)!
dikranmarsupial
“Requiring bit-level reproducibility for stochastic simulation is a bit unreasonable – in most cases we ought to be more interested in whether the stochastic variability from run-to-run is suitably small that we can place reasonable confidence in any given run.”
Well, the issue here was whether running the same executable on the same machine, no parallel processing, same seed, same data would give the same result twice. Which it should, and does. The point is for regression testing – do your changes to the code change the output? Sometimes changes should change the output, after all that’s the point of changing the underlying theoretical model and then implementing those changes. Other changes – say speeding up I/O or the like – shouldn’t.
Obviously this has nothing to do with the stochastic simulation itself, and the developers talk about doing a lot of testing to make sure the model is giving reasonable outputs for a range of parameters, seeds, etc.
But as I said earlier, it’s just FUD. When calls were made to open source the thing, it was obvious the point was to discredit it, just as was attempted when climate model sources were published.
> Requiring bit-level reproducibility for stochastic simulation is a bit unreasonable
It’s at the very least bit-level unreasonable.
I’ll grab my coat.
You can be sure that no Real Programmer would be caught dead writing accounts-receivable programs in COBOL [1], but
[1]: See https://web.mit.edu/humor/Computers/real.programmers
Pfooey! Ed Post was 30 years too late.
My mother was a REAL programmer on the brace of IBM 704s at what was then named Los Alamos Scientific Laboratory. Only assembly code, FORTRAN II wasn’t good enough for blowing up atomic bombs to propell Stan Ulam’s space ship.
Operating systems? What’s that? REAL programmers ran their codes from the front panel after stacking their cards in the hopper.
dhogaza true – my simulations were all compute-bound batch jobs, and methods for speeding it up (e.g. choosing different methods to solve large sets of linear equations) don’t necessarily give bit-level identical results either, so not really typical. I’ve been experimenting with reproducible code for quite a while (the aim is to be able to type “make” and have the computer re-run the experiments, patch the results into the LaTeX source for the paper and then recompile that), but it is much harder to do once the time taken to run the experiments is more than a couple of days.
Fully agree about the FUD, has *any* skeptic ever done *anything* substantive with the source code of a climate model? [I’d genuinely be interested in positive examples]
What about the divide-by-zero error in the agricultural damages in FUND? Skeptics identified the problem and showed that it lead to climate damages being systematically underestimated.
Of course, you meant ‘skeptics’, rather than actual skeptics. And this is not really a ‘climate model’ in any normal sense.
Or in a different field, the ‘fun with Excel’ in Reinhart-Rogoff.
dikranmarsupial
“methods for speeding it up (e.g. choosing different methods to solve large sets of linear equations) don’t necessarily give bit-level identical results either, so not really typical.”
Sure. Change compilers and you might see differences, too. And, back in the day before the IEEE floating point standard was adopted, floating point hardware differences guaranteed bit-level results for floating point operations would aways differ from machine to machine.
And Willard’s comment points out how unfortunate it is that log2(10) is an irrational number, and how annoying bankers are for wanting their pennies to balance 🙂
Willard
FORTRAN had its issues. The first Mariner probe failed because a DO loop of the form
DO 10 I = 1,100
Was accidentally written as an assignment statement of the form
DO 10 I = 1.100
Insignificant spaces, in space …
FORTRAN ignored spaces (should that be present tense???), and this error was probably made by a keypunch operator, not the engineer. Don’t quote me on that. Real programmers always blame the keypunch operator 🙂
“despite MATLAB (especially back in the 90s) was mostly a front end for a set of highly efficient and reliable library routines written in, errr, Fortran (with some nice graphics)!”
most of the heavy duty math in R is just wrapped FORTRAN libraries
( for matrix calcs)
in the end it is quite a bitch, because some things ( Like SVD) will call these old fortran libs
and you get errors # that reference this old legacy Fortan code. so ugly I gave up
thank you for that Joshua
‘As I said at the very beginning, I hope my colleagues understand that here I am not accusing anybody. For I have, many times over during these days of confinement, felt that urge to interpolate data and make sense of the apparent inconsistencies they present. But I resisted it, largely because I knew it would have been a dilettantesque form of entertainment – and I do have a good substitute to data fitting in that compartment, as I spend hours playing online blitz chess, where I am, indeed, a dilettante (although a good one at that). So we are human beings: and we want entertainment, and we find it in weird ways sometimes. Nothing to be too concerned about.”
Every time I start a chart or download covid data I ask myself the same question.
why? why mosher? really, think about hard steven. Why are you doing this?
oh? you’re afraid. And then I realize that no amount of number fiddling will work better than
a mask and hand washing.
And so I have spent my time playing blitz chess again after years.. maybe 18 years since I was at a board.. oh wait it was 9-11 last time I sat down at the board. how long ago was that?
dhogaza indeed – I’ve always thought that “significant birthdays” ought to be 16, 32, 64 and then aim for 128. The years get shorter as you get older, so it sort of makes them equal intervals.
The good bit about R is the libraries, which is the main reason for using it (python is a bit like that, but not as bad).
I’ve got very to using python libraries. I do remember the days when I used to type out subroutines from the Numerical Recipes in Fortran book (I eventually got hold of a disk that had them all on there – still had to copy them directly into the code though).
From the linked crackpot article:
“I saw fits using Gaussian approximations to uncertainties which ignored that the data had completely different sampling distributions”
This sounds pretty much exactly what the nonsense IHME model was doing. Completely ridiculous. These people are supposed to be pros, and yet they pumped out this garbage for weeks (it’s improved recently). I’m afraid I am increasingly coming (rather belatedly) to the realisation that “mathematical epidemiologists” aren’t really mathematicians at all, rather they are biologists who are slightly better at maths than other biologists. Which is a pretty low bar.
James,
Yes, as I think I may have pointed out to you before, I’m finding this quite a tricky situation. I’m a big fan of leaving things to the experts (as that article about physics crackpots is suggesting) but there are some indications that the experts themselves didn’t always do a great job. Of course, that doesn’t necessarily invalidate the point being made in the article 🙂
ATTP – I had a similar experience, but with “Numerical Recipies in [Fortran Brutally Transliterated into] C”, before moving to MATLAB, where I eventually started adding C “mex” files to optimse the code by selecting the best BLAS routines for the operations, rather than letting MATLAB choose them. Then we got a High Performance Computing facility, which meant that I had to spend less time (over-) optimising code and could (in theory) spend more time thinking about the theory and algorithms (in practice, I have been teaching instead).
James Annan
“This sounds pretty much exactly what the nonsense IHME model was doing. Completely ridiculous. These people are supposed to be pros, and yet they pumped out this garbage for weeks (it’s improved recently).”
Their PR machine is still pumping out garbage. That bit has not improved, IMO.
Steven –
> Every time I start a chart or download covid data I ask myself the same question.
why? why mosher? really, think about hard steven. Why are you doing this?
Bingo. Is this just pure inquiry? Or are there other “motivations” as well? Why are you being an armchair epidemiologist?
> oh? you’re afraid.
Sure. I think there are other factors as well. But yah, much does boil down to fear. The need to distract from the reality of mortality. Mortality has become much harder to avoid lately.
What’s ironic is that we wind up being divided by an experience that is so fundamentally common among us.
Don’t know if you saw this:
https://www.theguardian.com/world/2020/may/15/flying-long-haul-during-covid-19-air-travel-has-never-been-stranger
> My mother was a REAL programmer on the brace of IBM 704s at what was then named Los Alamos Scientific Laboratory.
Wonderful.
“Don’t know if you saw this:
https://www.theguardian.com/world/2020/may/15/flying-long-haul-during-covid-19-air-travel-has-never-been-stranger”
ya someone passed that on to me.
This has been the absolute weirdest few days of my life.
In all of it there was this little piece of luck
I was sitting at LAX waiting for the Hotel shuttle ( no cabs no uber) pretty beat.
I got on the shuttle and as we got to the hotel I realized.
I
Left
my
Computer
Bag
At
The
Bus
Stand.
That would be all my phones, passport, everything except my wallet.
Opps. I have never done that in years and years of travel
I paid the driver $100 bucks to race back to the airport.
Since I am typing this you know the ending. We got to the airport and there were 3 flight attendents
standing where I had left my bag. Thankfully they had given it to security.
Whew.
Otherwise, I would be stuck in LA.
If y’all have a chance to watch Midnight Gospel, go for it.
It reminded me:
https://www.mit.edu/~xela/tao.html
Willard
“The Tao gave birth to machine language. Machine language gave birth to the assembler.
The assembler gave birth to the compiler.”
Well I first learned machine language, and began writing an assembler because we didn’t have access to the assembler from the manufacturer.
And then became a compiler writer …
Oh, my. Reading about the company that had to revert back to COBOL because they didn’t understand rounding brings back so many memories.
Numerical Methods is a specialized branch of Computer Science. I’ve seen too many people that are “computer experts” that have no clue. I started learning computer programing (nobody ever finishes) in the punch-card/mainframe days, and we were actually taught about the perils of floating-point arithmetic. Things like:
…so things like “IF (b-a) = 0.2…” probably won’t behave the way you expect. And thinking that “(N/10)*10” will actually be N is a dangerous place to put your brain. Double-precision reduces the problem, but does not remove it.
A quick Google search produced this nice short list:
https://my.eng.utah.edu/~cfurse/ece6340/LECTURE/links/Embarrassments%20due%20to%20rounding%20error.htm
(The stock exchange example was the one I was looking for).
…and that site has a link to the ubiquitous Risks Digest that has been tracking these kinds of boners for decades.
http://catless.ncl.ac.uk/Risks/
Dikranmarsupial:
I was working as a Linux system administrator at Los Alamos National Laboratory when I retired. I didn’t do a lot of programming there, mostly adhoc scripting with Bourne shell, perl and finally python. I wrote a fair amount of Fortran77 and C early in my career, but perl was my most productive language ever since it was introduced, for its string processing. Assembly language was fun when I took a course in it, and felt like talking to the machine in its own language, but I didn’t use it after that.
The computational physicists I worked with at LANL, OTOH, were familiar with Fortran and C, but were happy to use R and Matlab for their diverse add-on functionality, because it saved them a lot of writing what they needed themselves: imagine that! Python immediately became popular because of the easy access to contributed extensions and class libraries. The lab contracted with a private outfit to maintain a python IDE, together with specified modules and extensions. And many of [the scientists – W] found python’s object orientation more intuitive than their earlier procedural approach. TBH, I myself did not. I thought python’s rich pre-written functionality was quite handy, but my own code was all procedural. I eventually decided it might be time to retire 8^)!
David B. Benson:
I grew up in a college town and liked science, so I was inculcated with the Los Alamos legend early. I still like the stories from the first decades, of historic physics achieved by heroic scientists who happened to be building weapons of mass destruction. I’m afraid I was rather disillusioned when I started working there. They’re still working on WMDs, but it’s hard to imagine the present-day LANL producing any Nobel-level physics 8^(. I came to recognize various causes for the lab’s decline from its heyday, to be sure. The computing infrastructure at my arrival was especially underwhelming, although the raw processing power was impressive. Be that as it may, the PhD physicists of my acquaintance were domain specialists, who cared about meeting scientific standards. They didn’t care so much what language or OS REAL programmers used, but went with whatever got in the way of their productivity the least. I for one am a Linux evangelist, so they probably all thought I was a geek. Hey, if the foo shits… 8^}.
I orphaned a “them”. The sentence should be “And many of the scientists found python’s object orientation more intuitive than their earlier procedural approach.”
[Fixed. -W]
Vaguely remember Goldberg’s “What every computer scientist should know about floating-point arithmetic” was a reasonable place to start (doi:10.1145/103162.103163).
I finally got the IC code to run on my iMac. with 32GB. It works fine and is not too slow at all.
Basically you must also
1. Install cMake
2. switch off the parallel processing option in the make file
3. install r package “sp”
4. Fix various host specific paths.
The example “non-intervention” scenario they provide is extremely scary with R0=3 and over 600,000 deaths in the UK over 2.5 months! In his original paper I believe Neil Ferguson actually used R0=2.4 and an IFC of 1% resulting in 500,000 deaths.
There is nothing wrong with FORTRAN. You can write clear and structured code.
However, the code has now all been transferred to C++ 😉
Mal – I’m starting to move to Python, but only reluctantly. The main reason is so that I can give away research toys for others in my field to play with. Python is widely used in machine learning, but mostly because of libraries like SciKit-learn and most of the deep learning tools have python bindings (I have been experimenting with Stan which is a probabilistic programming language with a python interface). I tend to write object-oriented code a fair bit, but I don’t like python’s approach to this (especially the lack of proper encapsulation), but with matplotlib, it is a good second best to MATLAB, with the advantage of being free.
C & C++ are my favourite languages for general programming, but I get to do hardly any of that these days (mostly just answers to the coursework I set). It is a shame that programmers don’t get much exposure to assembly these days, it helps you to have some appreciation of what the computer is likely to do with your code, and having some empathy with the hardware makes you a better high-level language programmer (IMHO). It’s also enjoyable in the same way that a difficult sudoku puzzle is enjoyable.
https://twitter.com/niklasfrykholm/status/1063242674717679621
Clive wrote “There is nothing wrong with FORTRAN.”
I wouldn’t go quite that far!
“You can write clear and structured code.”
agree with that though. Use a programmng language that allows you to program in the style that is best suited to the structure of the problem you are trying to solve. Shoehorning a procedural problem into an object-oriented structure is sometimes a recipe for inefficiency and a less maintainale baroque architecture.
Object Orientated Programming became too much of of a religion.
It’s brilliant for user interfaces and smartphone apps, but fairly irrelevant to scientific FORmula TRANslation 🙂
dhogaza (or anyone else for that matter) –
Would you do me a favor? Andrew rightfully reprimanded David and me for gumming up the recent comments.
I want to respect that, but on the other hand David’s now commenting on a statistics thread and I think that Andrew should have a little background. I was going to post the following and thought that maybe it’s better of someone else does it (It’s still a distraction but maybe less so if I don’t do it?). Anyway, here’s what I was going to post – a few tidbits from David’s past reflections on Andrew. If you post it, don’t forget to let Andrew know that dyp6629 = David Young
————————————-
dpy6629 | April 19, 2020 at 11:29 pm |
Josh, This Gelman is a nothingburger. He admits he’s not an expert on serological testing and that he doesn’t know if the Ioannidis paper is right or not. I think I’m done with your low value references.
and
Gelman looks like someone who likes to hold forth on subjects he is ignorant of such as serologic testing. He then tries to shame other scientists who know much much more than he does. Typical blog thrill seeker whose conclusions can’t be trusted.
Woops. I forgot the time stamp for the 2nd comment…
dpy6629 | April 20, 2020 at 5:15 pm |
Gelman looks like someone who likes to hold forth on subjects he is ignorant of such as serologic testing. He then tries to shame other scientists who know much much more than he does. Typical blog thrill seeker whose conclusions can’t be trusted.
Clive Best:
The “brilliant for user interfaces” is compatible with DM’s “research toys for others in my field to play with”. Python was an immediate hit with guys doing exploratory data visualization with sliders 8^).
In my callow formula-translating days, I said “COBOL is the COmmon Business Oriented Language for common business-oriented people” in self-congratulation. I hereby apologize.
Thanks Willard!
Joshua,
Where is that comment from DPY from?
> Gelman looks like someone who likes to hold forth on subjects he is ignorant of such as serologic testing. He then tries to shame other scientists who know much much more than he does. Typical blog thrill seeker whose conclusions can’t be trusted.
Where has David Young from the Boeing Company (who recently made a white paper about engineering practice disappear from his publications’ page) said that?
If you go to Gelman’s, you’ll see he has a listing in the recent comments thread where he asks Andrew a question.
He also, of course, left a dig after I apologized to Andrew for gumming up the recent comments. Such a classy guy, eh?
The two comments I put up were from Climate Etc., a few threads ago:
Afterwards he did walk it back just a tad:
If anyone is going to drop off David’s comments, please only do it briefly and in the thread where he asked Andrew his question. I don’t want to add anything to the other thread where Andrew asked that the childishness cease.
I’ll also point out that when I criticized the quality of the human subject methodology in the Santa Clara study and said it shouldn’t have passed an IRB review, and that anyone who does human subject science would know that, David first explained that I am not a scientist and then he explained that I post anonymously, and then he explained that he’s been publishing research for 40 years.
I didn’t realize that they do human subject research at Boeing.
David’s gonna David.
“Josh, This Gelman is a nothingburger. ”
ROTFLMAO
Oh, and also, aside from the childishness, I think some folks here might be interested in the discussion up at Andrews about “informative priors.” I recall that was a subject of a discussion here a while back – I think in particular in connection w/r/t Nic’s ability to determine which priors are “objective?” 🙂
James left a comment in his customarily diplomatic tone:
https://statmodeling.stat.columbia.edu/2020/05/17/are-informative-priors-incompatible-with-standards-of-research-integrity-click-to-find-out/#comment-1339344
Mal “The “brilliant for user interfaces” is compatible with DM’s “research toys for others in my field to play with”. Python was an immediate hit with guys doing exploratory data visualization with sliders 8^).”
????
By “research toys” I meant libraries implementing my methods so that other researchers could build on them. No sliders involved (although they are often object oriented as that facilitates their extension/modification by the users).
Re James’ comment – calling it “objective” is even worse (as it is a jargon meaning of “objective” rather than the one in general usage, but that distinction is rarely made by those promoting them).
This is a neat demonstration of a “play with a research tool”. “Build your own zero-emissions energy system”:
https://model.energy/
For those who are bored of armchair epidemiology and looking forward to armchair energy system planning.
Joshua,
Which of Andrew’s threads was the one where he “reprimanded” you and DPY?
“…so things like “IF (b-a) = 0.2…” probably won’t behave the way you expect. And thinking that “(N/10)*10” will actually be N is a dangerous place to put your brain. Double-precision reduces the problem, but does not remove it.”
In over 45 years of Fortran programming. particularly since my default is dp code for most of that time, I have very rarely run into any such issues, as long as you keep your floats over here and your integers over there, when dealing with mixed ops I have always converted integers to floats (well the integers are still there, I just will not do comparisons between data types). I code in baby steps now, in fact all my codes are baby codes, so that I rather quickly run into problems that need corrections. The baby algorithms are mostly in my head now.
I am very wary of those potential issues though. Always.
Anders –
Here:
https://statmodeling.stat.columbia.edu/2020/05/14/so-much-of-academia-is-about-connections-and-reputation-laundering/#comment-1339357
I seriously love David’s parting shot. He steadfastly turns down the chance to show any grace whenever provided an opportunity.
Thanks
Reading that thread, I thought it nice that DPY excused the human failings of the researchers involved in the Stanford study. Based on my past interactions with DPY, that seemed quite out of character. You might think that it’s because the Stanford study produced results that suited DPY’s preferred narrative, but it can’t be that, surely?
I’ll be generous to David and assume that he has no idea what kinds of expectations there are for human subject research. Too bad that he can’t just admit that than insist thst he has some expert perspective on omit by virtue of his background. It just makes him look bad instead of just lacking knowledge.
It will be interesting to see what happens with that “whistleblower” report described at BuzzFeed. Is it really a whistleblower? Is there evidence to support the accusations?
If so, I would hope there will be disciplinary action taken. If not, if they defer to the reputation and esteem of Ioannidis et al., it would be a stain on Stanford.
> Which of Andrew’s threads was the one where he “reprimanded” you and DPY?
This one:
https://statmodeling.stat.columbia.edu/2020/05/14/so-much-of-academia-is-about-connections-and-reputation-laundering/#comment-1339357
Willard,
“Real programmers always blame the keypunch operator”
Real programmers used IBM card punch machines and then fed the cards through a RIOS (Remote Input Output Station)
http://cds.cern.ch/record/1816218
Joshua
“I didn’t realize that they do human subject research at Boeing.”
Boeing 737 MAX … researching how quickly human pilots can react in a crisis situation …
OK, that’s not very nice of me.
I’m trying to imagine what would explain a researcher testing a few thousand participants for antibodies, with a test that gives false positives, and knowing that at least some participants have been told that a positive test could be a passport for going back to work, and then being resistant to informing the participants the implications of a false positive and offering them a follow up test.
To the point where someone else in the research team would withdraw from the publication becsuee of rhe ethical implications.
I mean I get motivated reaoning – but that’s just indefensible in my book. Knowing that some infectious people could be walking around thinking they have been informed that they can’t infect anyone – as in, say, their grandmother or spouse or child?
I guess that puts me into the “data cleaning” bin:
what did you do before enlightenment? chop wood, clean data.
Well, that ‘s much of the point. In the code, (0.4-0.3) and (0.3-0.2) might be expected to be equal, but in base 2 there is no guarantee. In VBA single-precision code in Excel, the results are 0.1 and 0.09999999. You won’t notice it unless you force Excel to show you more decimals than it wants to. (Excel normally uses double-precision internally. Fewer problems, but not zero.
And (N/10)*N might be equal to N for sufficiently large values of N, after rounding, but if N is an integer, and N/10 is converted to floating point, and the result*10 is stored back into an integer variable with truncation, you can bet your sweet bippy that something will eventually go wrong.
I was also taught that when doing mixed mode, make sure that you make the decisions where to cast to a new type. When I and J are integers (there’s that FORTRAN train of thought), and the (maybe ancient) compiler is happy doing integer math without forcing to floating point, I=1 and J=10 and K=I/J will result in K=0.Even with I/J is cast to float, truncation can give you a smaller result that you expect.
Don’t trust the compiler to cover your @$$.
Well, we have a winner:
While the arcania of the various features and flaws of FORTRAN, PYTHON, R MathLab are undoubtedly of importance in all this, (whats wrong with FORTH? ) it somewhat misses the purpose to which this argument has been put.
All the major newspapers in the UK are now running the story that the computer modelling used is WRONG, with the clear implication that the lockdown, social distancing, and testing are all a malicious imposition of government control that is both unnecessary and economically disastrous.
The ‘SUN’ as usual has the most dismissive headline –
“-‘IT’S A MESS’ Professor Pantsdown’s ‘Stay At Home’ lockdown advice based on badly written and unreliable computer code, experts say”
The issue has ceased to be about the quality of the code, or the modelling, but this is now being used to Attucks and change the policy response to the pandemic for reason other than scientific quibbles about computer language or variations in stochastic models.
As with climate change, the attacks on models have little to do with computational purity, but are a proxy battle against the inevitable policy conclusions that can be derived from the best scientific knowledge we have of the issue
“whats wrong with FORTH?”
great language for a small computer (like my first computer – the Jupiter Ace)
Treating it as a Fermi problem (“how many piano tuners are there in New York?”), just take fifteen minutes to knock up a spreadsheet, and you’ll soon find out you’ll overwhelm the health service within weeks.*
Box was right. All models are wrong. But Ferguson’s was useful.
*there are also a slew of studies that point out almost every spreadsheet on the planet contains errors. We still use them.
@-dikran
“great language for a small computer (like my first computer – the Jupiter Ace)”
Yeah, I wrote a sound-to-light show program in FORTH on a Sinclair Spectrum back in the day…
easier than machine code/assembler (grin)
The articles (not sure they are really in ‘all the papers’ but certainly in most of the populist and right-wing ones) are a pretty broad-spectrum hit-job on Ferguson, really, although some of them lead with the code stuff. Actually the Daily Mail one even includes more relevant/reasonable criticisms about the choice of parameters used in the models.
This is a general challenge for any domain which involves computer models, which is basically all of them. It is now standard practice to open-source anything with public-policy implications, and I think nobody really expects or wants that to change. But any bug, or even a deviation from someone’s idea of ‘coding standards’, no matter how minor, will be presented by some as a fatal flaw discrediting the work. Won’t get that much traction unless it significantly changes the results.
But the most effective ‘big hit’ against Ferguson is still going to be his personal contravention of lockdown. I mean, obviously, if you are in the public gaze, you are going to be subject to personal attacks, so your life isn’t going to be the same. You are now a minor celebrity: deal with it. Maybe the peak science bodies should do more to provide media and public image advice/services for heavily exposed scientists?
Don’t think much of this is a problem that scientists can solve. You need a press corps with sufficient science literacy and integrity to be able to correctly identify which issues are consequential, rather than one that makes a habit out of skewed hit pieces. Don’t think that will happen any time soon, given the slow apocalypse traditional media is undergoing.
Ben,
One problem (I think) is that modellers don’t always do a great job of highlighting the limitations of their model. In the case of a model trying to represent something complex, like how our various interactions might spread a virus, it’s probably impossible to capture all the complexity. So, it seems unlikely that any model results will accurately represent what happens. However, this doesn’t necessarily matter if you’re trying to check if we might swamp the healthcare system (it mostly matters whether or not we will end up over-capacity, not whether it’s10 times over, or 50 times over). Similarly, a model might not be able to precisely predict the outcome, but it can still probably tell you something of how various different strategies might change the outcome. If there are indications that we might end up many times over-capacity if we do nothing, we would want a strategy that substantially reduces this, rather than one that would only have a modest effect.
Yes, even though this has little bearing on the science, I still find it annoying. He must have been aware that he would be in the spotlight.
“…for any domain which involves computer models…”
A minor nit to pick, but it always bugs me when people talk about “computer models”. Science makes use of mathematical models. Computers are just one way of solving these. Calculus and Algebra exist independently of computers. Analytical solutions exist for many cases of mathematical models, independently of computers. Computers just happen to be a convenient and fast way of finding solutions to some problems, but the concepts are inherently mathematical.
If the contrarians’ bloviating of “you can’t trust computer models” were expressed as “you can’t trust mathematics”, then it would be obvious how empty their rhetoric is.
You can’t make predictions without a model, even if there is no computer and no maths either, there is still some conceptual model involved. If you don’t have that, it isn’t a prediction, it is merely a guess.
In my experience, most contrarians bloviating about other peoples computer models become rather reticent when you ask them about the model underpinning their predictions.
Yes, even a “descriptive model” is a model…. a collection of words describing how you think something behaves.
Mathematics is just a well-defined collection of such descriptive models, with standard symbols (it’s own language) using well-defined concepts with well-defined rules on how those concepts link together. “Y = mX+b” is just shorthand for “Variable Y appears to be related to variable X in that any increase in X is matched by an increase in Y in proportion m, and when X is zero, Y still has a non-zero value of b”.
The definition of “model” that I tend to use is “an abstract representation of reality”. There is always a level of abstraction. It is never an exact duplicate of reality. Yet such abstractions can be useful if they do a good job of approximating some portion of reality. (There is probably a shorter, niftier, well-recognized descriptive model for that concept. 🙂 )
Even this comment does not completely express the true nature of my thoughts – it uses the English language to provide you with a descriptive model of my thoughts.
Is this a model, or just Excel curve fitting at its so-called finest?
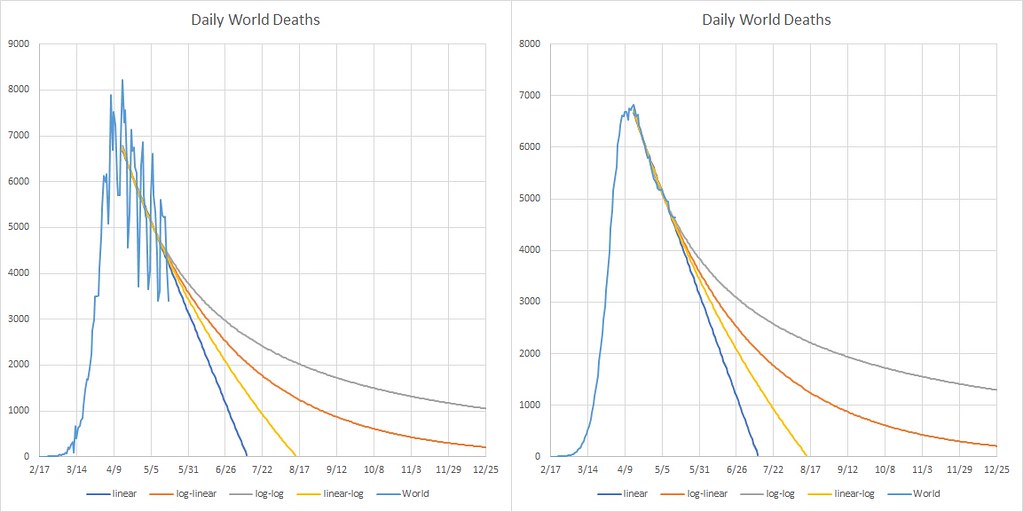
I’d go with curve fitting. Taking the most conservative (slowest decay), which is the power law decay (log-log), I’d expect half a million deaths in the July time frame (same applies to the exponential decay (log-normal).
Really not much of a prediction. All fits may decay slower than as shown.
‘log-normal’ should be ‘log-linear’ per graph labels
It’s simple, really. No model, no measurement. No model, no data. No model, no implementation of any theory whatsoever. Unuseable science.
And yet:
https://twitter.com/nevaudit/status/1261291311161884682
Just for the sake of amusement…
I didn’t let Andrew know of David’s previous reflections on Andrew’s contributions. And after Andrew noted that David was rather “rude,” David respondied.
David Young says:
May 18, 2020 at 12:05 am
Andrew, Joshua is quote mining a long comment thread with lots of other comments. What I meant to say is that your post is in my opinion a nothingburger. I don’t know about the statistics part but it seems to me the critical issue is the serologic testing. In that comment thread it is also stated that you are a world class statistician, a comment I agree with. I apologize for the thrill seeker comment.
Joshua has been heckling me on blogs for several years. He shows up with very repetitious and often unscientific comments and always brings up his motivated reasoning ad hominem. It just gets very frustrating to have every interaction taken down the same road into internet diagnoses of my “reasoning” and state of mind. In addition its unethical.
++++++++++++++++++
Ah, irony. Where would the blogosphere be without irony?.
Ooops. I “did” let Andrew know…not “didn’t.”
On perhaps a positive note – that perhaps presents a different dynamic than the attacks on scientists dynamic:
I think a few folks who read here are from Oz? I’m curious if any of them have any thoughts?
“whats wrong with FORTH?”
Dunno. I was waiting for FIFTH to come out.
Still waiting 😉
Yeah, sure, what the “skeptics” are attacking is really details of the code implementing a mathematical model. Because it turns out that whining about the appearance of code is a lot easier than actual real verification and validation or understanding maths.
ATTP: I agree that the limitations of the models are not well described in popular media. But I don’t think it is realistic to expect a careful conversation with any significant amount of nuance. And I certainly don’t think this is the ‘main problem’.
‘We predict between X and Y deaths if no policy measures are taken’ is about as good as it is going to get. I guess you could have ‘this will require 50x as many hospital beds as we have’ as well.
Something like ‘the model uses a continuum model that represents viral spread on a coarse-grained single-pool population level, rather than simulating the details of individual interactions, or considering inhomogeneous subgroups’ seems several steps too far to me.
I guess you could have ‘these are highly idealised models of disease spread through the population, but have been effective at capturing the broad features of previous epidemics’.
Ben,
Indeed, but I wonder if the model limitations are even made clear to the policy makers.
Joshua,
One of the issues I have with DPY (amongst a number) is that he seems to expect people to respect his expertise while regularly dismissing the expertise of others (Gavin Schmidt and Andrew Gelman being two prominent examples). It’s not only that this is rather rude, it also suggests a rather a severe case of motivated reasoning, which would then suggest that one should be cautious of taking anything he says seriously (IMO, at least).
Anders –
Agreed. His apparent disregard for, or inability to recognize, his obviously hypocritical complaints about ad hominems also suggests a severe case of motivated reasoning.
I left a comment at Andrew’s:
More than one link gets you in moderation at Andrew’s.
But srsly, we all should give it a rest. David’s gonna David.
Willard –
> But srsly, we all should give it a rest.
I agree. Done.
“Indeed, but I wonder if the model limitations are even made clear to the policy makers.”
Well, having worked in government for the last 25 years, and having seen some policy shops in action, the policy wonks frequently don’t have the time to listen, and don’t necessarily have the technical skills to understand the limitations. The really bad policy wonks have drunk the kool-aid and honestly think they can learn everything they need to know to advise the policy makers, after only a few hours of “talking to the right people”.
The good policy wonks will have a strong background in the subjects they are asked to advise on. The bad ones think that changing areas/departments every few years is a sign of broad experience and knowledge, and is required for a successful career. (i.e., my idea of bad is their idea of good.)
Welcome to “Yes, Minister”.
“Yes, Minister” was the first thing I thought of, too…
AFAICT, the initial idea that it would be a bad idea to intervene too early was an actual error of judgement, though, rather than communication.
I have got it running
I’m Australian and the Federal Govt hasn’t changed it’s ideology. They have long been anti-China and blandly racist; this was just an opportunity to shine… Cutting off flights from China was a key part of the response.
Then the State Govts did their part so we can’t travel between States without going into quarantine.
Australia doesn’t have the ‘individualism’ that seems apparent in the US, our history is more about helping each other (as long as you’re not black or Asian) through the tough times, so there is a streak of collectivism. We worship events (like Gallipoli, Tobruk, The Kokoda Trail) that were tough and where we all had to work together to succeed or fail (like Gallipoli) rather than heroic individuals (we tend to mock heroes), so it wasn’t hard to get people to work together.
The Federal Govt will use this to pursue their agenda of watering down labour laws and the stimulus will support their big-business mates… Same same really.
Australia also did very well during and after the GFC because the Labor Govt (the more Socialist one) spent big on infrastructure programs and handed out cash. Although the Conservatives mocked them and ridiculed the programs it was pretty clear they worked, so in this worse situation there’s no way they couldn’t follow suit.
Hmm. In the beginning I was rather surprised at De Blasio’s get it done approach
and heartened by Cuomo’s approach to data driven decision.
However, De Blasio has gone mad and watching Cuomo’s team explain needlessly complex metrics has been a disappointment.
Looks like NY will employ Imperial College. watch the guy .
yuck.
meanwhile,
feet on the gound
https://wwwnc.cdc.gov/eid/article/26/8/20-0633_article
I think part of the leveling that started in April is due to the fact April is warmer than March. That would mean the worry about the reopening soon causing a 2nd wave may be all for nought. If so, the fall could be a disaster with nation behaving recklessly with a virus that has its mojo back.
COVID-LAB: MAPPING COVID-19 IN YOUR COMMUNITY
A successful virus type is able to replicate and then transmit. So if too virulent the host goes to hospital, breaking the transmission.
Examples include the viruses causing the so-called common cold. Just enough to keep going.
My amateur opinion.
Hey ATTP, would you care to output a zoomed-in view of what was happening in the early stages of the run, say up to mid or late march, in terms of cases and deaths? Would be interesting to see how it compares to reality…
James,
Sure. I’ve put two figures below. Unless I’ve messed up, these are from the sample parameter files they provided using R0 = 3.0. Some of what they presented in the papers was for R0 = 2.4. I’ve plotted cumulative deaths and then infections, both for 100 days, starting on 01 Jan (i.e., ending around 09 April). In both cases it’s for scenarios where no interventions were introduced.
Let me know if there is anything else you’d like. I’m certainly not yet completely familiar with all the parameters in the code, but I can give it a try.
James,
Do you have any idea what is going on with this Imperial model: they have a ‘country-specific lockdown factor’ that does most of the work, but I’m struggling to explain how it worked for Sweden:
https://mrc-ide.github.io/covid19estimates/#/details/Sweden
I’m wondering if the country-specific results on the web are produced using the country-specific stan code.
what’s illuminating is some of the critics complain about the model being built for “Flu”
this is an example i have seen on a “skeptic” website
“The model itself does not withstand independent scrutiny and is based on some deeply flawed assumptions, namely that it’s based on the spread of a flu like virus”
I think these idiots mentally picture a “model” a bit like a model aircraft or model boat
“The model itself does not withstand independent scrutiny and is based on some deeply flawed assumptions, namely that it’s based on a model of a Sopwith Camel not a Messerschmitt BF 109”
the modellers have literally built a physical model of a Sopwith Camel – doh
i don’t think they have the mental cognitive strategies to internally compute what a computer model is and what it isn’t
Thanks ATTP, I was hoping for something visible:-) how about log scale so we can see the rate? Putting real data on would be good too 🙂
James,
Now you’re asking a lot 🙂 Let me see what I can do.
Seeing as you’re here James, it would be intriguing to see what your model now calculates R for Sweden. Any chance of running that? My assumption is R~1 as deaths are stable or very slightly declining?
@Ben
That is a different IC “model”. It is some mainly R code which tries to derive some Baysian statistical inference from the actual case data.
https://github.com/ImperialCollegeLondon/covid19model/tree/master/stan-models
It is indeed very confusing .
Clive: yes, I guess I should have mentioned that the Imperial model I linked is not the model in the OP. I don’t think the model itself is too complicated, but I’m struggling to understand the results…
This looks suspiciously good. Of course, it assumes no interventions (which started on around day 83). I have a telecon starting in 15 minutes, but will try to look at this some more later. Black points is the data from here.
David, this virus has little or no selection pressure favouring less lethal forms.
Death rates are minuscule among the population that will breed the next generation of hosts. And its long asymptomatic but infective period and high reproduction ratio means that even those who are sick enough to stay at home undirected won’t slow it down. Doubling rates for deaths (as a proxy for infection 2-3 weeks earlier) were down to 2.5 days in the UK before lockdown, despite its current lethality. It would need a “hopeful monster” mutation that made it less harmful without impacting transmission, rather than a chain of small mutations each favouring a slightly less lethal form.
Something like Ebola, with a 50% death rate across generations, would be a completely different matter.
This is what I get if I include the basic interventions. PC = place closures. SD = social distancing. CI = case isolation. HQ = household quarantine.
Finally, this is what I get if I consider cumulative infections. The black dots are, again, from here and almost certainly undercount the total number of infections. The model would suggest that a few million people in the UK have already been infected. This would be ~5% of the population which is – as far as I’m aware – consistent with testing that has been done elsewhere.
Dave_Geologist
“Something like Ebola, with a 50% death rate across generations, would be a completely different matter.”
Ebola’s a wildcard because the bodies themselves are highly infectious … and in fact burial practices were a major factor in its spread and a cultural barrier that had to be overcome to help knock it down. The 50% death rate just increased the odds of coming into contact with bodily fluids (let’s face it, Ebola’s symptoms are gross) while preparing a body for burial, etc.
In the case of respiratory diseases, bodies don’t breath, so a 50% death rate would be a different matter, and indeed MERS, with a death rate of about 36% in humans, has a basic reproduction rate of less than 1. Except it doesn’t kill camels, who just get a snotty nose so once the mutated form capable of infecting humans became established in camels, oh well, things sucked.
So for David Benson … things aren’t as simple as they might seem on the surface.
Of course I find wanting to maintain the burial practices of one’s culture a lot more defensible than the urge to maintain our cultural practice of assembling in large groups waving AR-15s and proclaiming the desire to use force to stop government from implementing policies meant to save lives, but that’s just me.
ATTP
That’s very cool and does suggest that the underprediction of 7K-20K UK deaths with interventions was perhaps due to their use of an R0=2.4 rather than any fatal structural issues with their agent-based SIR model.
That’s interesting ATTP though it’s clearly not the simulation they presented in March. I wonder how much has changed apart from R….they said in the paper it was initialised to have the same deaths to March 14. Maybe I should try to get it running – is it easy? I have a macbook pro laptop.
How do the interventions cause a change before they are introduced, I wonder? Is that just a random seed thing?
James,
Yes, there are a large number of parameters and I’m not convinced that how they’re set in the publicly available version is the same as was used in the model results they presented in March.
It is pretty straightforward. However, I’m running on a cluster which I think has all of the necessary compilers installed by default. As a rough guide, it’s taking about 20 minutes using 24 cores. So, probably a few hours on a mac (depending on how many cores you have). I do know of someone who was trying to run it on their macbook and ran into memory problems.
Yes, I think it must be this. The interventions should be doing nothing until after day 84.
James Annan
“That’s interesting ATTP though it’s clearly not the simulation they presented in March. I wonder how much has changed apart from R….”
When MicroSoft first took charge, moved to C++, using OpenMP, etc they did validate against the original model outputs. However it’s not clear if that original model was exactly the same as the one used to present information to the UK government back in March, i.e. the IC team might’ve been working on improvements between then and when MS got involved.
Currently, the model is definitely changing. For example this commit:
“Added Death from influenza-like-illness (ILI). Previously could only die from Severe Acute Respiratory Illness (SARI) or Critical. ” Comforting to know we can die in three ways now 🙂
Ferguson has been doing some tweaking in portions of the model, as have some other members of the team. So it’s a moving target. What you see in the repository is what they’re using in their active work consulting with governments, judging from comments they’ve made.
So the closest you can get to the model’s state back in March would be to use git to grab the initial files used to create the repository, but it’s not clear how close that would be.
vtg sez …
“Seeing as you’re here James, it would be intriguing to see what your model now calculates R for Sweden. Any chance of running that? My assumption is R~1 as deaths are stable or very slightly declining?”
.https://www.folkhalsomyndigheten.se/contentassets/4b4dd8c7e15d48d2be744248794d1438/riket-skattning-av-effektiva-reproduktionsnumret-2020-05-15.pdf
See Figure 2 for R (in Swedish, but correctly looks to be ~0.9)
OK something is being parsed so that it inserts a big empty space,
riket-skattning-av-effektiva-reproduktionsnumret-2020-05-15.pdf
From here …
folkhalsomyndigheten.se/smittskydd-beredskap/utbrott/aktuella-utbrott/covid-19/analys-och-prognoser/
[Added a dot in front of the PDF line; it seems that sometimes WP wants to embed it and gets stuck. -W]
Tack så mycket Everett!
Vi skriva på svenska i dag.
Ioannidis meta-analysis if IFR. Shocker, he finds it Lowe than other analyses.
https://www.medrxiv.org/content/10.1101/2020.05.13.20101253v1
This part is unreal:
> For the other studies, healthy volunteer bias may lead to underestimating seroprevalence and this is likely to have been the case in at least one case (the Santa Clara study)19 where wealthy healthy people were rapidly interested to be recruited when the recruiting Facebook ad was
released. The design of the study anticipated correction with adjustment of the sampling weights by zip code, gender, and ethnicity, but it is likely that healthy volunteer bias may still have led to some underestimation of seroprevalence. Conversely, attracting individuals who might have been
concerned of having been infected (e.g. because they had symptoms) may lead to overestimation of seroprevalence in surveys.
So he ignores some of the ways that the Santa Clara study might have been an overestimation because of the recruitment processes.
But then he doubles down to ignore the many reason why that Santa Clara would be an overestimate – do to higher median income, lower minority population, etc. with respect to a broader exptrapolation beyond Santa Clara.
Another example of John’s thumb on the scale:
>Locations with high burdens of nursing home deaths may have high IFR estimates, but the IFR would still be very low among non-elderly, non-debilitated people.
He ignores the uncertainty in the other direction; i.e., does Santa Clara have *fewer* long term care facility residents than what would be nationally representative? He consistently looks at the uncertainties only in one direction.
As someone who has long respected Ioannidis, I am having a hard time understanding how poorly he’s approaching the uncertainties in all of this.
More on the Santa Clara team:
https://twitter.com/CT_Bergstrom/status/1262854364512677888?s=20
“So he ignores some of the ways that the Santa Clara study might have been an overestimation because of the recruitment processes.”
I am not a fan of his but there is a fundamental problem in designing the collection
of any serology data.
Take something as simple as where the testing is and the requirement that people drive to the testing center.
Imagine that mass transit is a source of transmission. That, if you ride the bus your chance of catching a case is 2x that of someone driving. We dont know.
Now we know that race plays a role in mortality and gender does, so we can adjust for these factors in our sampling. We can sample across factors we know play a role.
age, race, gender, etc. But there are holes in our understanding of all the factors that lead to
infection, asymptomatic presentation, and outcomes.
Like in Korea, all of our early cases were young people. The testing was skewed waay young.
Bottom line. I would hate to have to design any sampling strategy for these tests. Whatever you
do is going to be subject to second guessing and unknowns.
In new york it appears they will test 280,000. 140K of essential workers, and 140K of people
who sign up.
My bet is they wont collect enough profile data or behavioral data and definitely wont publish it.
meanwhile, where is the CDC?
Model suggests masks effective ;o)
Rats [sic] link should have been
https://fightcovid19.hku.hk/hku-hamster-research-shows-masks-effective-in-preventing-covid-19-transmission/
Steven –
I agree the rush to characterize seroprevalence has people way out in front of the data. The data are what they are. The problem is trying to extrapolate from those data as Ioannidis is doing.
He then rationalizes the data to match his priors, as in saying that Santa Clara should be an underestimate – how has he quantified his speculated reasons for less prevalence their as compared to relevant factors such as race and ethnicity and SES, and their associated factors such as access to healthcare, comorbidities, likelihood of being an essential worker, prevalence of multi-generational households (and exposing older people to infection) yes, rate of use of public transportation, etc.? It doesn’t appear he has quantified any of that. Just speculated away without providing evidence.
I think it’s bizarre.
FYI:
https://phys.org/news/2020-05-covid-extreme-scientists.html
Hard to extrapolate.
David Benson
Well, there’s nothing new in the phys.org piece that I can see.
They build a SEIR model and found it’s non-linear and highly sensitive to R and the length of the incubation period. You don’t have to build a model to learn that, a few minutes in google would suffice. And it’s well known that the quality of the available data isn’t great. It’s a bit like an epidemiologist rushing up excitedly to a physicist and saying “I just experienced this cool thing called ‘gravity’, have you heard of it?”.
This conclusion is a bit odd, though:
“”Preliminary results show that implementing lockdown measures when infections are in a full exponential growth phase poses serious limitations for their success,” said Faranda.”
When else would you? In the very beginning when there are relatively few people infected, it’s in “full exponential growth phase”. After a few doublings it’s still in “full exponential growth phase”. When exactly is it a good time to knock Rt down below one, if not then? Are they suggesting we sit back and wait for herd immunity to kick in rather than lock down?
“meanwhile, where is the CDC?”
Same old question, same old, and all to obvious, answer. Two words. Small Hands.
You haven’t been watching the 4th season of The Apprentice: White House Edition wherein Small Hands plays with himself on both sides of the table.
OT: a bit of climate with your SARS reading:
Potential Factors Influencing Repeated SARS Outbreaks in China
Meanwhile…in Sweden…
I’m not particularly critical of Sweden’s approach. It’s one of the variety of bad choices.
But when you look at the metric of deaths per capita, you will note that the rate of decline is Sweden considerably lower than in many other countries, such as Switzerland, the Netherlands, even France, and many, many other countries. Sweden is rising up the chart at a consistent pace.
In fact, Sweden has had the higher per capita deaths in Europe over the last seven days. Even higher than the UK.
Cross-country comparisons are of limited value. And the reasons for Sweden’s relatively slower decline than elsewhere are complicated. And there are necessarily tradeoffs in all of this, but you can’t even evaluate the tradeoffs if your vision is limited by your ideological blinders.
Audits never end:
Willard –
Assuming what will happen with the rapid peer-review…..can wrong preprints be considered to be “wrong” published research?
> can wrong preprints be considered to be “wrong” published research?
Preprints are not published.
I think about that often.
“Preprints are not published.”
They’re just publicized …
pre-prints are fine, it is the press releases that are the problem.
(IMHO)
Also from Sweden: a month ago, about 5% of people had been infected.
https://www.folkhalsomyndigheten.se/nyheter-och-press/nyhetsarkiv/2020/maj/forsta-resultaten-fran-pagaende-undersokning-av-antikroppar-for-covid-19-virus/
I just ran Ferguson’s model for Sweden
Clive,
How did you set the parameters for Sweden?
“IMPORTANT: The parameter files are provided as a sample only and do not necessarily reflect runs used in published papers.”
Now on Clive’s page, regarding the run for the UK with lockdown results using R=3.0 which he thinks is too high, well, because … he says:
“If you look at the bottom red curve which shows excess deaths directly related to COVID-19 then you can see that the lockdown predictions more or less agree with the outcomes. Does that mean that Neil Ferguson really did call the right shot?
Probably he did, yet still today we have a fundamental lack of knowledge of the real-time numbers of infected and recovered persons in the UK.”
So it works well for the UK case, suggesting that maybe it’s not a model flaw causing the results for Sweden to be so off. I’ve seen no indication that Sweden has been working with the IC group so I’m guessing that no one, except Clive, cares about the model run results for that country.
“This current obsession with R is actually misleading government policy because R will naturally change during any epidemic. R will always reach 1 in coincidence with the peak in cases and then fall rapidly towards zero.”
Well, yes, R will always be 1 at the peak. It doesn’t appear that Clive understands that without intervention, that happens when herd immunity kicks in, i.e. lots of cases and lots of deaths. The obsession (as he calls it) with R is because the goal is to get control over the thing without reaching that very high level of infections and deaths.
And he goes on:
“At some point the costs of continuous stop-go lockdowns based on fear alone will become unbearable. We will have to learn to live with this virus.”
Based on fear alone?
“How did you set the parameters for Sweden?”
I would assume:
./run_sample.py Sweden
But note the caveat about the parameter files …
dhogaza,
Yes, I realise that it has admin files for Sweden, but the available parameter files appear to be for the UK, the US and Nigeria.
ATTP
Right, for the US and Nigeria it uses those param files, everything else uses “preUK_R0=2.0.txt”
ATTP
So a reasonable assumption would be that they’re only working on production projections for the US, Nigeria, and the UK.
I used “run_sample.py Sweden” However I think there is definitely a bug because the intervention scenario comes back as “Sweden_PC7_CI_HQ_SD_R0=3.0.avNE.age.xls” but it is still using the UK population size !
This is what it should look like (IMHO)
dhogaza,
Yes, that’s my understanding too. So, that may impact why Sweden’s results look a bit odd.
I don’t know if anyone else noticed, but James Annan got a mention in George Monbiot’s latest column for highlighting that starting the lockdown a week earlier would have substantially reduced the number of deaths.
I posted to Twitter a set of IC model runs which considered lockdown starting one week earlier, or two weeks. I deleted it when James pointed out that the earlier lockdowns had more deaths early on than the later lockdowns. I thought this might because I’d messed up the initial start times between the different runs, but I get the same kind of result when I try to fix that. I’m not quite sure what’s going on, but it could be that closing schools and universities then leads to some extra contact in other environments (the model does assume that there are enhanced household and community contacts when schools and universities close). Anyway, the figure I produced is below. It certainly shows quite a substantial reduction if intervention had started a week earlier, but maybe not quite as much as James suggests.
This is interesting.
“Bayesian adjustment for preferential testing in estimating the COVID-19 infection fatality rate:
https://arxiv.org/abs/2005.08459
Very mathy.
But seems they only looked at likelihood of sampling reflecting a disproportion with respect to infected people wanting to get tested.
So much other important unrepresentativeness (e.g., variables highly predictive of health outcomes like SES and race/ethnicity) that basically make most of these seroprevalence studies worthless, in my non-expert opinion (that plus $2.50 woukd have gotten you a cup of coffee pre-shutdown)
Anders –
> I’m not quite sure what’s going on, but it could be that closing schools and universities then leads to some extra contact in other environments (the model does assume that there are enhanced household and community contacts when schools and universities close).
That’s interesting.
@dhogaza
Thanks ! I think you are right !
Is there any documentation as how to set up the parameter files ?
Josua,
It’s one of the parameters in the parameter file. I don’t know if the assumption about enhanced contact in the household/community if schools/universities close is reasonable, or not.
Clive,
Other than the brief instructions on github, I don’t think so. I have had trouble trying to work it out. I’ve worked some of it out, but I still can’t work out how to trigger interventions on and off, for example.
ATTP,
This seems to happen in all scenarios at the beginning of a lockdown even their sample run.
It doesn’t make sense to me either.
Anders –
It certainly was my reaction when I first heard that they were sending university students home – that they would just spread virus to their families. . But when I thought about it more, I thought that just leaving students in student housing would maybe be even worse long-term.
The again, if it makes intuitive sense to me, that’s probably an indication that it’s wrong. 🙂
I’m wondering if the model is automatically rescaling to match data at a certain date. I guess the llog-scale graphs would show this, if that is what is happening. In other words, the pre-intervention curves should match each other.
Joshua,
There is an age dependence, so maybe the model suggests that leaving students at school/university leads to fewer deaths, even if it doesn’t impact the overall number of infections.
Clive,
Yes, even if you look in the Table in the Report 9 that they produced, it also shows some oddities. I think it may be that there are assumptions about contacts once the intervention start that can lead to some counter-intuitive results. These parameters may be wrong, of course.
Ben,
No, even the log-scale graphs don’t match. It could be that I’ve made some change that somehow changes when the infection is initialised.
Anders –
> There is an age dependence, so maybe the model suggests that leaving students at school/university leads to fewer deaths, even if it doesn’t impact the overall number of infections.
Except it’s unrealistic, imo, to think that you can keep them segregated, long term. They would destroy the student housing before moving out into the community (says someone who has rented houses to students).
That’s what so many of the rightwingers miss with the whole “just protect the old people and stop stealing my freedom ” rhetoric. That’s also unrealistic. Especially for older people in poorer communities, only the least because they’re more likely to live in multi-generational households.
“Joshua,
There is an age dependence, so maybe the model suggests that leaving students at school/university leads to fewer deaths, even if it doesn’t impact the overall number of infections.”
some of the models have “mixing” matrices that “capture” how much/often old people mix/contact
with young people.
As a lover of models I have to say I think they are being misused at this point.
I dont think you can use them to fine tune policy. well you can use them, just not convinced it
will beat trial and error.
to put it bluntly. Some communities will open beaches, some will open for walking only,
some will drag you from the water if you swim, and some will keep them closed.
None of it is based on any science or data analysis whatsoever. People will use
models as cover for whatever they want to do.
I too like models:
> People will use models as cover for whatever they want to do.
And people will use the policies local governments implement to address COVID for whatever they want to do.
As one example, freedom fighters will yell “freedom” to feel good about their identity.
Think of “Keep the government’s hands off my Medicare” if you want a good example.
Oops. Anyone have Nic’s phone number?
> STOCKHOLM (Reuters) – A Swedish study found that just 7.3 percent of Stockholmers developed COVID-19 antibodies by late April, which could fuel concern that a decision not to lock down Sweden against the pandemic may bring little herd immunity in the near future.
https://www.reuters.com/article/us-health-coronavirus-sweden-strategy/swedish-antibody-study-shows-long-road-to-immunity-as-covid-19-toll-mounts-idUSKBN22W2YC
Sweden is pulling it off:
https://medicalxpress.com/news/2020-05-stockholm-virus-antibodies-sweden.html
So far, so good.
@-David B Benson
From your link to the medicalexpress article –
“Sweden’s strategy is aimed at pressing down the curve so the healthcare system is not overwhelmed, while allowing the rest of society to function as near normally as possible.”
A strict lockdown also avoids overwhelming the healthcare system, AND reduces the total number of excess deaths. But at the ‘expense’ of the near normal functioning of society. Especially the economic activity.
This makes explicit the policy choice that governments are making between the number of people who die and sustaining the status quo during a pandemic with a significant IFR. The near normal functioning of society is surprising resilient to a big jump in daily deaths, so that is preferred by some (US, Brazil ?) to the alternative of a significant disruption of the economic and social system by policies that minimise the number of dead.
A death toll is chosen over a economic cost.
What’s up with article? The headline says:
> 1 in 5 in Stockholm have virus antibodies: Sweden
The first paragraph says:
> Sweden, which has controversially taken a softer approach to the coronavirus pandemic, said Wednesday that more than one in five people in Stockholm were believed to have developed antibodies to the virus.
The 2nd paragraph says::
> An ongoing study by the country’s Public Health Agency showed that 7.3 percent of a sample of randomly selected people in Stockholm—Sweden’s worst-hit region—had antibodies when they were tested in the last week of April.
? 7.3% = more than 1 in 5?
Also intersting that the souffle I linked has a very similar text but a comeletely different slant.
Lol. Souflle = article.
Joshua,
Isn’t the argument that it was around 7% towards the end of April but is now something like 20%?
7.3% is the number actually found in tests a couple of weeks ago. The ‘1 in 5’ is an estimate for the current number thrown out by the head of the health agency in a press conference: not clear how they arrived at that figure, but they have been saying similar things before, so I suspect they haven’t ‘updated their estimate to reflect new information’.
(clearly more than 7% have now been infected, but three times that amount now seems unlikely)
5% of overall population is really not encouraging for the ‘herd immunity’ proponents.
Anyone who believes Swedish society is operating near normal need only speak to a Swede.
The effect of their voluntary lock down is little different economically to other countries mandatory lock downs.
Sweden currently has the highest death rate per capita in Europe.
Whether their strategy works better over the long term regarding morality remains open.
They have accepted more deaths as the price for more freedom in the short term. The economic short term effects have been similar to other European countries.
Here joshua,
santa clara sampling
Apropos various comments:
So Sweden only has to kill ten times as many people to reach herd immunity. Assuming of course that infection, and particularly mild symptoms, actually confers immunity and that it lasts.
The large impact of a week’s delay in lockdown should be obvious. Assuming the same R time series after lockdown, the final number infected and final death toll simply scales with the number of seed cases at the time of lockdown. Since UK deaths and presumably prior infections were doubling more then twice a week, every week’s delay equates to five times as many cases and five times as many deaths before it’s over.
As I’ve said before, estimates of high enough asymptomatic rates to make anywhere close to herd immunity yet and the IFR anything like flu require vastly different asymptomatic-to-symptomatic ratios between countries. Otherwise there are countries and regions with more than 100% infected. While that may be plausible if you compare Italy with countries in sub-Saharan Africa with young populations, it would seem unlikely for those affected so far.
Or alternatively, that people in those places have already had it more than once and infection, asymptomatic infection at least, doesn’t confer immunity. In which case “painless” herd immunity is a pipe dream.
Anders –
> Isn’t the argument that it was around 7% towards the end of April but is now something like 20%?
OK. So guess that’s their argument. But where’d they get that number? Why would it take months to get to 7% then a bit under 4 weeks to go from 7% to more than 20%. Would exponential growth alone explain that without some kind of in described reason for rate change?
Joshua,
In the UK, the doubling time was initially less than 5 days. If that were the case in Sweden, then going from 7% to 20% would occur in less than 4 weeks. However, that assumes that people don’t change their behaviour, which does seem a bit unlikely.
Anders –
So with a constant doubling rate, would 7% over two? months (first case in Sweden was Jan 31, but let’s assume it took a while to get up to doubling speed) get you to over 20% in 3 months?
Joshua,
Yes, I think so. If you look at the blue line in the figure in the post (“Do nothing”) the UK would have gone from virtually nothing to the peak in just over 2 months.
Steven –
Thanks!
So I’m not a total idiot afterall?
I absolutely love the illustration of the problem with convenience sampling (at about 28 minutes)!
Anders –
Thanks. But clearly behaviors did change over that entire period. They’re always talking about how well they’re social distancing. So the doubling rate didn’t remain constant. Seems we could presume the doubling rate was higher during that Feb. – late April period. And I’m presume that one or two weeks at the highest doubling rates has a disproportionate of impact.
So I’m skeptical about that number
ATTP: yeah, if the pre-intervention curves don’t even match and the initial infection changes then the code and/or the way you are running it isn’t right.
I also think Dave and James’ analysis make sense: the whole thing is close to linear, so moving the intervention a week early should just stop two doublings from happening in the model.
Ben,
Yes, that is odd. All I’m doing is adding 7 days on to the time when the interventions should start, but this seems to then be influencing what happens before the interventions are introduced. The only other possibility is that it’s to do with the stochastic nature of the simulation, but it seems too big of a difference for that. I’ll maybe have another look.
Okay, I’m not entirely sure what is going on, but it looks like there is some Trigger threshold that you set and also the day on which it occurs. When you then change the start of the interventions, it looks like this then changes the initial phase of the infections so as to then reach this threshold on the specified day.
Going from 7% to over 20% would require 2/3rds of the infections to happen in the last month. That isn’t consistent with the case or death curves and would suggest that things are getting out of control. But given the 20% figure seems to have ‘limited empirical support’ it doesn’t seem worth spending too much mental energy on.
Ben,
Yes, I agree. It doesn’t look like it’s going out of control, so 7% to 20% in a month might be an unrealistic rise.
Steven –
Great point at about whether they should have even provided confidence intervals for convenience sampling!
And that chart at @39 minutes is killer. Do the Santa Clara authors even understand the implications of the base rate fallacy to their studies?
Wtf is wrong with Ioannidis?
Oh – the point about confidence intervals and convenience sampling is at 45 minutes.
ATTP
“When you then change the start of the interventions, it looks like this then changes the initial phase of the infections so as to then reach this threshold on the specified day.”
In the original flu modeling paper the scenario was that the virus crosses from animal to a person, then the infection ramp-up begins but unknown to authorities. Action by authorities is impossible during this time of course. Then at a certain point when you have a certain number of infected people, authorities become aware something novel’s going on, and can intervene. The parameterization you’re talking about seems related. Maybe …
ATTP, I do agree that a more sophisticated model might not precisely reproduce the result of the simple SEIR model. Lockdown increases transmission in the household, for example, and the effect of school closing depends on when schools are open. But it seems very strange that by taking action on day 69 (isn’t it?), the model generates a perceptible rise in deaths in a mere 5 days, rising to several hundred by about day 80. I would suspect the modelling as being not quite right there unless a plausible explanation can be found.
Again, a log plot of the start would be useful. I also very much prefer looking at daily values rather than cumulative – you can see any change in slope so much easier, for both cases and deaths.
Ah I’ve crossed a few comments there while having my lunch. Point about looking at daily numbers on a log scale still stands though 🙂
James,
I’m trying to run everything again, but I think the issue is that the parameters are set to match a certain number of deaths on day 100, which is then influencing the early phase of the infection when you set the interventions to be much earlier.
> Souflle = article.
If only.
In other news:
Ah ATTP that makes some sort of sense as they specifically talk about hitting a death total in their 16 March paper (on 14 March in that case).
James,
Yes, that must be what it is. Whatever date I set the interventions to start, the model will try to match the number of deaths on 14 March, which then means that the initial spread of the infection ends up being influenced by the assumed date on which the interventions start. I think I’ve worked out how to change that, but it now seems that all my colleagues have found time to start using our cluster and my jobs aren’t starting as fast as they used to 🙂
Anyone seen David?
https://twitter.com/K_G_Andersen/status/1263246859054641152?s=20
https://twitter.com/K_G_Andersen/status/1263248650592899074?s=20
Steven Mosher,
“santa clara sampling”
Thanks for that video presentation, very informative.
Joshua,
That twitter thread is also very informative, JA posted it and that;s where I read the whole thing.
https://threadreaderapp.com/thread/1262956011872280577.html
The whole thread (I hope) all in one place.
In reality Neil Fergusson got it mostly right for the UK !
More thoughts about that 7.3% to 20% in Sweden.
The number for late April reflects infections for two weeks earlier – around April 7th. . And the 20% now isn’t seroprevalence but actual number. So that makes it more like 7 weeks to go from 7% to 20%.
If R reduces naturally in Sweden to say ~1.2 then herd immunity can be reached at just a 30% final infection rate.
Clive Best,
Don’t really know what you are showing, mirror image like?
Per comment upthread the Swedes currently think that their R~0.9 not R-1.2.
“If R reduces naturally in Sweden to say ~1.2 then herd immunity can be reached at just a 30% final infection rate.”
except of course there are neighborhoods in the Bronx that have infection rates over 40%
Oh, and they are still reporting cases.
basically. NYC realized that cases are highly geographically concentrated
so they have started doing full population testing in key areas.
this stuff has a very high spatial frequency
so extreme care should be taken with any spatial averages.
there is no UK, no Sweden, no USA. heck even in Korea we have different patterns for different regions.
Even cities have wildly varying numbers. Saw that early on in Beijing which had crazy different
numbers across the various districts. Same with NYC
as data this reminds me of rainfall data ( complete with “floods” overwhelming dams) There are downpours and droughts and drizzle. Its ugly ugly stuff from a geostats perspective.
“So I’m not a total idiot afterall?”
nope. I was on WUWT after this first came out trying to explain the problems with sampling.
its funny how all the skeptics became gullible -ists
The slide at 39 minutes is great.
Only a few more days left in Quarantine .
going kinda stir crazy. Its been quite an adventure since leaving Beijing in Jan.
not exactly what I would have predicted for 2020
“This also means John can go back to writing his sequel – I propose calling it “Why Most Published Research Findings Are False – with Personal Examples from Ongoing Pandemics”.
that left a mark
Guys,
It’s time for some game theory:
Peru failure:
https://www.theguardian.com/global-development/2020/may/20/peru-coronavirus-lockdown-new-cases
What went wrong?
David B Benson
The article makes it quite clear as to what went wrong.
Steven,
Is there a source for this?
Okay, I found it. Seems to be data here. There are regions where the percentage of cases that test positive is around 40%. Not sure what the testing strategy is.
Clive, Sweden will only be able to maintain herd immunity with 30% infected only for as long as they also maintain their current soft lockdown. Which (combined presumably with cross-border effects like loss of tourism and customers and broken supply chains) looks set to hurt their economy just as much as the hard lockdowns are affecting their neighbours. As soon as they release it, up goes R and bang goes their herd immunity. So they’re stuck in a circular treadmill like all the other hamsters, it’s just a different-shaped treadmill.
Dave_Geologist ,
Yes I think you are right. We are all caught in a Catch-22 situation. The more successful we are at curbing the the outbreak the harder it becomes to return to normal. Even countries like New Zealand who may even eliminate the virus completely will have to self isolate from the rest of the world indefinitely.
At some point the knock on effects including deaths from a collapse in the world economy will outweigh the effects from the virus. The only way out of this dilemma is either a vaccine or a new drug treatment which renders COVID-19 a mild disease.
The other solution is herd immunity via all the under-40s getting it and none of the over-60s (at least, over-70s). That way basically no-one dies. Though it’s not trivial keeping the oldies safe while this happens.
I think the reality may turn out more complex.
As we work out best clinical practice, with or without new drugs, we’ll reduce the fatality rate.
As we understand transmission better, we’ll be able to better target relaxing restrictions.
As vaccines become available (perhaps as early as late this year) even if not 100% effective, they may reduce transmission and/or fatality enough to reduce the seriousness of the pandemic to levels we can tolerate.
https://www.theguardian.com/world/2020/may/21/astrazeneca-could-supply-potential-coronavirus-vaccine-from-september
As we understand the immune response and its longevity, and observe outcomes in different jurisdictions, the effectiveness of herd immunity type strategies will become clearer.
As testing speed and accuracy improves, and tracing workflows are honed, less restrictions will be needed to contain the virus.
And our response will vary accordingly as evidence emerges on all these points.
I think the catch-22 scenario outlined is possible, but very much worst case.
Make of this what you will
> The Population Fatality Rate (PFR) has reached 0.22% in the most affected region of Lombardia and 0.57% in the most affected province of Bergamo,which constitutes a lower bound to the Infection Fatality Rate (IFR)…Combining PFR with the Princess Diamond cruise ship IFR for ages above 70 we estimate the infection rates(IR) of regions in Italy, which peak in Lombardia at 23% (12%-41%, 95% c.l.), and for provinces in Bergamo at 67% (33%-100%, 95% c.l.).
https://www.medrxiv.org/content/10.1101/2020.04.15.20067074v2
James –
> The other solution is herd immunity via all the under-40s getting it and none of the over-60s (at least, over-70s). That way basically no-one dies. Though it’s not trivial keeping the oldies safe while this happens.
Not trivial?
In the United States, at least it is unrealistic, in the extreme.
There are many multi-generational families who cannot segregate older people. There are millions of older people who serve as primary caregivers for grandchildren (snd they have higher rates of comorbidities than their non-caregiver counterparts). Many older people (say 65+) are employed. They have to shop. They take public transportation to get to doctors, to go shopping. Many depend on others to come into their homes for caregivjbg. They have to interact with the general public in myriad ways.
We can’t get anywhere near to your no one dies scenario.
On top of which, some younger people do die – at varying prevalence in different localities, morbidity from COVID is also a huge impact.
In the US, we have nowhere near the infrastructure to realize that scenario. Talking about it in Sweden, with a robust national healthcare infrastructure and a general attitude of shared responsibility for the public welfare, it is one thing to talk of a herd immunity approach.
Talk of a herd immunity approach in the US is an entirely different discussion.
I imagine the UK might be somewhere in between, but still light years away from Sweden (given the % if people who live alone, population density, etc.)
Er… Multi-generational households (not families).
Life as normal but travel to infected countries is inconvenient = nice problem to have.
Yeah. I’m gonna go there.
I hope that everyone who enjoys the ability to isolate themselves and their families from risk, to at least some significant degree relative to their desire to do so, reflects on the difficulty that people from other segments of society (i. e., people of lower economic status) have in protecting themselves from risk.
As such, I sincerely hope that they remain cognizant of those differences whenever they reflect on the wisdom of a “herd immunity” approach, or those approaches that might be closely related.
Yes, it’s theoretically possible that longer term the same number of people will be infected either way. It’s also possible that longer term considering economic impact, a herd immunity approach will result in less pain and suffering differentially than an approach that relies on government mandated social distancing to some extent.
But there’s no way to avoid the reality that it’s a gamble either way. It’s decision making in the face of vast uncertainty.
Respect the uncertainty. Avoid magical thinking.
@-Clive Best
“At some point the knock on effects including deaths from a collapse in the world economy will outweigh the effects from the virus.”
I am unconvinced this is an unavoidable inevitability.
Deaths could occur from a collapse in the agricultural infrastructure so that famine becomes a problem. But historical examples show that food production within a Nation and the transport of basic necessities can sustain a food supply that avoids widespread death, it just means you no longer have a choice of 57 varieties of breakfast cereal or much meat.
The ‘world economy’ is a very recent invention, much of it was not in place a few decades ago, 75 years ago the world economy was a very different animal. While the current world economy may lack resilience in the face of extended lock-downs and other measures to reduce the death toll, it may be possible to modify it in ways that avoid significant deaths from its collapse. Unless there really is no way that the basic needs of food, water management, and shelter can be met EXCEPT by BAU, or that the resistance to change is so great that alternatives that would avoid extra deaths cannot be made.
I just had a zoom conversation with my cousin. He was in University College hospital London for a heart problem (130 bpm when resting) and awaiting surgery. He was instead discharged home because of the coronavirus emergency with a follow up appointment 1 month later to which he went. Unbeknown to him all appointments had since been made telephone only, but the bureaucracy had failed to informed him. When he arrived for the appointment the staff were drinking coffee and was asked what was he doing there. He needs an operation but everything else is now delayed indefinitely because of the coronavirus panic. His consultant said there are now up to a 1000 on the waiting list, so if he can afford it go private.
I am sure there are thousands of other examples across the UK
Indeed, Clive.
And I’m sure you thought about what this implies regarding your usage of “panic.”
Willard,
Perhaps a better description would in the benefit of hindsight be “over-reaction”.
You indeed overreacted, Clive. You’re describing a situation by implying that doing nothing would have been even worse for the medical system. That’s false:
Just to be clear, it must be terrible to be waiting for surgery that is now delayed because of the current crisis. However (as I think Willard is highlighting) it may well have been preferable to have acted faster, rather than slower.
Of course it’s terrible to wait for surgery. But consider the kind of magical thinking it requires to believe that less interventions would lead to more surgery and overall more GRRRRROWTH.
Unless one can show that less intervention leads to less death, the whole line of argument is pretty theorical. Decisions had to be made. They were. They mostly were suboptimal. Now what?
Modelling is not worth much without constructive proposals, and in fact most policies are quite agnostic regarding what contrarians are trying to peddle.
But then what else is new.
“coronavirus panic”
If they had panicked when China panicked there would be a very low number of COVID-19 deaths and the population oof the SARS-CoV-1 would be essentially zero worldwide. The economic damage would be minimal, and we would be going forward to a largely SARS-CoV-2 free world, just as we live in a SARS-CoV-1 free world.
China has a drug therapy in the works which appears to be exceedingly effective, and they just reported successful results on one of their Phase-2 vaccine trials in the Lancet.
Herd immunity with no vaccine, and I have seen it in real life more than any of you, was/is a stupid plan. JFC.
The other counterfactual: Imagine no government mandated shelter in place.
More infected people wandering around. More supply chain interruptions. More over-burdened healthcarw workers. More people unable to get surgery for a longer period of time.
Prove that wouldn’t have happened. Hell, prove that it’s less likely than the ‘Things would have been better absent a “lockdown.”
Meanwhile, I have a fixed value that takes higher priority for me. We owe deference to the heroes who have put their lives on the line to make others safer and healthier, myself and Clive included.
Ask them what they think. Value their input
Choose your cfscodite counterfactual. It’s your right. But don’t pretend you actually know what the fuck would have happened had things been different. And don’t discount what the heroes have to say.
Thank you wife for me, Willard.
JCH –
Imagine a viable vaccine, manufactured and is tributes, before the curves of “herd immunity” and government mandated shelter in place would have equalized.
Now imagine the openers responding when it is pointed out that the herd immunity approach cost lives through the faster drive to infecting enough to achieve her immunity.
Whatch how they respond. We can ask Clive what he thinks if that happens.
God that makes me cringe:
Meanwhile, American billionaires got $434 billion richer during the pandemic.
That’s something like 1200$ per American.
Not family.
Person.
Willard –
> Meanwhile, American billionaires got $434 billion richer during the pandemic.
Source?
But draconian!
But Tyrants!
But Lysenko </strike? Oh, wait, that's climate change.World = World – CN, RoW = World – (CN + EU + US) and SA = South America
LHS = log-linear and RHS = linear (LHS = RHS just one is log and the other is linear)
Speaking of herd immunity, we just might see that occur (e. g. in SA) sooner rather than later. I’d also expect to see the totals for many 3rd world nations (which includes my homeland, the US) to be gross underestimates as the poorest people will go mostly unnoticed (numerically speaking). In other words, BAU. 😦
I’d call them The Uncounted.
@-Clive Best
” He needs an operation but everything else is now delayed indefinitely because of the coronavirus panic.”
The NHS in the UK has a regrettable tendency to delay and postpone any elective treatment until it develops into an unavoidable emergency. Like Sweden it has be subject to ‘austerity measures’.
But just to present a hypothetical alternative, your brother is admitted and gets his heart surgery while the hospital is dealing with an increasing number of COVID19 cases. Hospitals are notorious for cross-infection problems. He catches the Corona virus and requires ICU or treatment on a high dependency ward when there is a shortage of beds. The fatality rate of his surgery gets multiplied by the risk of the fatality rate from COVID19. There are reasons why hospital close to all but emergencies when they have an outbreak of antibiotic staph infections.
There is a judgement that has to be made about the trade-off between continuing with the ‘normal’ pattern of elective treatment when the risks are increased by an infection, and the risk of deterioration and acute conditions because of the cancellations during a period of high cross infection risk and a shortage of facilities.
Such judgements are sub-optimal, often because the system is under-resourced for ‘normal’ operation, never mind a rapidly expanding infection with a 10% IFR for the elderly with comorbidity.
In the UK, the hospitals have indeed stopped doing any non-urgent procedures.
This is because the COVID cases were forecast to occupy the full capacity of the healthcare system, and that was pretty close to the mark. Also, a substantial fraction of patients coming in without COVID were contracting it in hospitals. Now that there are somewhat fewer cases coming in, it looks as though hospitals will go back to more normal soonish.
This is why the ‘official government slogan’ said ‘protect the NHS’. By squishing the epidemic, you prevent the epidemic from overwhelming the health care system, and prevent too many of the health care workers getting sick at the same time, and the NHS can get back to work sooner.
What would have mitigated this problem significantly is starting policy/lockdown earlier (1 week means about 4x fewer beds occupied by COVID patients). If the lockdown were more effective (e.g. track+trace), that would also help shorten the time that the NHS is not able to offer the usual services.
As to the World, it just might have a 2nd peak, which is really just the 1st peak circling the globe, largely unchecked.
That should be – Methicillin-resistant Staphylococcus aureus (MRSA) infection – above.
Its a reasonable parallel with how a hospital has to respond to any raised risk from cross infection.
“What would have mitigated this problem significantly is starting policy/lockdown earlier (1 week means about 4x fewer beds occupied by COVID patients).”
Which is what I said almost a month ago (following JA’s lead) …
“Except NYC started with a doubling time of ~ONE DAY! IMHO tens of thousands of lives could have been saved if NYC lockdowns had started 2-3 weeks before their actual 2020-03-22 lockdown.”
The CU study used March 8th and March 1st which is almost exactly 2-3 weeks before the official NYC March 22 lockdown.
https://www.medrxiv.org/content/10.1101/2020.05.15.20103655v1
In hindsight, I made a lucky guess.
Izen: Sorry, I cross-posted. You covered most of this ground.
Another thing starting measures a week earlier does is dramatically shorten the down-slope of the epidemic, because it takes about 3 times as long to go down as to go up (at least with a UK-style response).
The infamous, and fugly, doubling time graph …

World = World – CN, RoW = World – (CN + EU + US), SA = South America and BR = Brazil
Of greatest concern is the RoW (black line), which has taken ~37 days to double its doubling time (from ~10.5 days to ~21 days, with the last 30 days looking almost frightening linear in log-normal space). In other words, the RoW currently has the lowest long term doubling slope.
I think I’ve managed to get the Imperial Code working so that I can check the impact of earlier lockdowns. I’ve essentially set the code to fit the numbers on 5 March, which is earlier than the start of all the interventions. I’ve also set the number on this date so that the cumulative deaths in the latest intervention roughly matches what’s occured.
It looks pretty much the same as James got. Locking down a week earlier would have reduced the number of deaths by almost 30000.
Thanks ATTP that looks rather good. I’m sure you will be tweeting it 🙂
Of course the long-term outcome is still highly uncertain. We may end up all getting it and 1% dying anyway, but even in that case we can try to manage it at a tolerable level..
Just sent you a tweet 🙂
Seems to me this gives essentially the same answer as solving some simple coupled ODEs (i.e. a basic SEIR model), but without the benefit of being able to quickly see exactly what is going on. But I guess the point was to check that this complicated IC code is roughly equivalent to the very simple models.
Ben,
Yes, exactly. The Imperial College code does have lots of parameters and I still don’t have a good sense of how sensitive it is to these parameters (i.e., could I have got a wildly different answer if I’d made some small changes to some of the parameters). However, it does seem consistent with what the basic SEIR codes are suggesting, which does add some confidence that locking down a week earlier would have had a substantial impact (I also don’t think that this is all that surprising).
ATTP, perhaps too much effort was made (in government committees as well as with the public) to educate people who don’t understand the exponential function on what the second term in A x 2^B does, and not enough into explaining what the first term does.
In fairness most people didn’t take maths far enough to reach natural logarithms and the exponential function, whereas multiplication is part of the 3R’s. But people have blind spots about stuff they know as well as about things they think they know but don’t (“exponential means really really fast”). How many think you have a fixed amount of post-lockdown deaths and just add them onto the pre-lockdown deaths, so losing a week and having a few thousand more deaths is small beer compared to the tens of thousands of post-lockdown deaths? I suspect rather a lot. I also suspect that of those countries which instituted European-style lockdowns, the biggest impact on the death toll is at what point during virus spread lockdown was imposed, rather than how tight the rules were or how compliant the population.
Dave_Geologist.
I don’t believe you.
Over hear wee haz Pheedoom Phiters an hay dont ned know bok learnin’. Oven hear Small Hands iz ann biznezzmen whoz nowz compond intrest lik itz waz nside hiz gutz.
Clive Best
” He needs an operation but everything else is now delayed indefinitely because of the coronavirus panic.”
Be careful what you ask for, Clive.
Izen and Ben McMillan outlined the potential dangers for you in the abstract. The dangers have nothing to do with “panic”.
In the real world, ten days ago we lost an acquaintance in the UK to covid-19. He was checked into the hospital for non-elective surgery, caught covid-19, and while at first he appeared to be doing OK, after a week or so deteriorated and was transferred to the ICU, where he died two weeks later.
Exponentiation explained so that even morans like Small Hands would (maybe) understand …
“This exercise can be used to demonstrate how quickly exponential sequences grow, as well as to introduce exponents, zero power, capital-sigma notation and geometric series. Updated for modern times using pennies and the hypothetical question, “Would you rather have a million dollars or the sum of a penny doubled every day for a month?”, the formula has been used to explain compounded interest. (In this case, the total value of the resulting pennies would surpass two million dollars in February or ten million dollars in other months.”
https://en.wikipedia.org/wiki/Wheat_and_chessboard_problem
It’s the starting value I was getting at too Everett. So in your example, do it again but put two grains on the first square. That’s several days delay in lockdown. Then do it with four grains on the first square. That’s a week or so delay in lockdown. Actually I had my own blind spot and the curve was already gently flattening with the hand-washing, self-isolation of symptomatic cases and initial social distancing. So allowing for time-lag, make it one week for two grains on the first square and two weeks for four grains.
I suspect that if UK ministers think about the consequences of a week’s delay, they think in terms of the 74 deaths on March 23rd vs. the 1684 deaths in the following week. About 1600. Or if they’re clever and slip it by two or three weeks to allow for incubation time and sickness before death, the thousand or so per day we were getting at the peak. But some of those would have died anyway so call if 5,000 and while regrettable, it’s on a par with an average flu season and better than a bad one.
But most of the deaths are in the long slow decline from the peak, and are driven by the height of that peak. By the time we reached our peak daily deaths were doubling about once a week, so a week’s delay makes the peak twice as high and two weeks’ four times as high. And all the plateau and decline deaths correspondingly double and quadruple. And they’re already three quarters of total deaths and daily deaths are barely down to pre-lockdown levels. With most of the deaths post-lockdown, you can say to a first approximation that a week earlier would have halved deaths, and a fortnight earlier quartered them. So I have no problem finding 30,000 plausible. Of course I could download the code and do it the hard way, but this is a more mentally stimulating rainy-day activity 😉
You can do it the delayed-action way, and do it well, but only if you go for a draconian lockdown and comprehensive test, track and trace, so you get R right down post peak infection and don’t have that long, slow decline.
@ATTP
Did you update the change times for all the interventions, or just Social Distancing ?
If I remember correctly, case isolation and household quarantine had already been implemented about a week earlier. The biggest effect was Social Distancing (closing shops, pubs, work places, transport etc.)
Clive,
What I did was set them all to start at the same time. I’m, however, trying what you’re suggesting now (i.e., what’s the impact if some of the interventions start earlier).
Sometimes I wonder why we should write fiction:
https://www.wired.co.uk/article/dominic-cummings-coronavirus-big-tech
That was on March 12.
I don’t always want to flatten a curve, but when I do I simply say “we need to flatten the curve” and cocoon.
Hmm, I guess the other one is, if the UK had managed to catch half the incoming cases before they stepped off the plane (and ideally before they got onto the plane) and taken other quarantine measures, it is plausible they could have cut the number of seed infections by a factor of two. That should also reduce the epidemic peak by a factor of 2.
But great news, everyone: quarantine for incomers will now be introduced in the UK! I’m finding the media coverage of that bizarre. Surely the obvious response is ‘seriously, are you joking introducing this now rather than in Feb/March?’, but the BBC coverage didn’t take that angle. People are talking as if the UK is a low-risk country that could allow no-quarantine travel with other low-risk countries in Summer. France has kindly introduced a reciprocal 2 week quarantine period, even though they weren’t consulted.
The change to infection load made by even small timing changes to quarantine procedures and other interventions is massive: this is a big part of the reason that the epidemic is orders of magnitude lower in some countries than others.
But this was all clear to the Sage committee at the time: the problem was initial ‘flatten the curve’ strategy, which appears to be herd-immunity in all but name, meant that the UK didn’t even really try to suppress. It took them a while to realise that killing off a few hundred thousand might not be politically viable.
> the BBC coverage didn’t take that angle
The Beeb proves once again to be a leftist megaphone:
“In the real world, ten days ago we lost an acquaintance in the UK to covid-19. He was checked into the hospital for non-elective surgery, caught covid-19, and while at first he appeared to be doing OK, after a week or so deteriorated and was transferred to the ICU, where he died two weeks later.”
when I first got to Korea I also got a normal pneumonia vaccine.
No way I wanted to come done with something normal and have to go to the hospital.
The spread in hospitals is pretty well documented here in SK. I dont know why they dont write more papers. Every cluster is pretty detailed. number of staff, number of patients, visitors and cases from contacts with those.
I imagine those numbers, secondary and tertiary attack rates would be important in calibrating models.
“ATTP, perhaps too much effort was made (in government committees as well as with the public) to educate people who don’t understand the exponential function on what the second term in A x 2^B does, and not enough into explaining what the first term does.”
reminds me of my experience on WUWT int the early days when folks were arguing that there were
only 68 cases and 0 deaths.
https://twitter.com/nytimes/status/1264312206914719745
“The source says that during the meeting, the attending government officials suggested that the UK will not implement strong restrictions on citizens’ movements – of the kind seen in China and Italy – and is instead aiming at “flattening the curve” of the contagion, staggering the number of cases over time in order to avoid overwhelming the hospitals.”
China was uniquely positioned and equipped to do a hard lock down.
First I want you all to see something
before I could grab this data from my Chinese sources the data was removed. But trust this
this chart is correct.
What you will see is something quite remarkable.
On Jan 23rd Wuhan was physically closed. flights ended, trains, cars, everything.
So there were seeds that spread out before that, but nothing after that.
EVERY CITY in china followed the same path ( with 3 exceptions).
Curve flattened in 15 to 20 days. ( the 3 exceptions had imported cases)
And that is exactly what you expect given the details of the disease.
So what was unique about china.
1. Jan 24th was the start of CNY. which meant BUSINESS SHUTS DOWN, not all business but
the vast majority. usually people return “home” like salmon. but in this CNY they just hunkered
down in place.
2. Staying inside: the approach to housing in many areas makes monitoring and control
pretty easy. There are large living compounds, think 30 story apartment buildings.
dozens of them in gated communities. ordinarily the guards just let you come and go.
But if they want to they can demand an ID and see of you belong there. heck your ID will
tell the guard where you are allowed to live, go to school, etc.
These guards and the local party members were immediately put into service.
A) checking people.
B) helping the elderly.
As an American travelling around China I always kinda chuckled at these guards that
patrol the communities. excess labor. Kinda like the road workers in the USA who stand
there watching the 1 guy who digs. But that labor pool was ready to be activated to
enforce the rules.
3. Delivery: Normally I hate these guys
they clog up the sidewalks and roads. Along with the motorcycle guys. But they were
key to surviving those initial 20 days
4. Wide testing coverage
anyway its almost June and some people still dont get it
Good vid.
9K new cases a day for UK
“anyway its almost June and some people still dont get it”
Well we know of one individual that will never get it. COVID-19 that is. And to them that is all that really matters.
Oh wait, you meant testing strategy. Same person. Same problem, Two words. Small Hands.
Willard, that NYT tweet, what a hoot, the visuals of Small Hands, as golfer as demented as reaper as personality disorders … gallows humor at its finest.
https://pbs.twimg.com/media/EYv5KfXU4AApDow?format=jpg
“Good vid.”
I havent been exactly honest when I said I did no charts.
early on I did one chart.
X axis: tests per million.
Y axis Positivity rate.
what mattered was the outliers on this chart.
Low penetration rate of testing and High positivity. ( not testing enough)
Low penetration and low positivity ( looking the other way)
High penetration and high positivity. ( overload, this was NY for the longest time)
watching the testing numbers in Korea daily it was pretty clear. for every person who
tested positive they were finding an extra 50-100 people to test. positivity rates were consistently
low, while penetration was Good .
And the numbers were consistent with the typical number of contacts per case.
when I look at the metrics people are using for reopening, I’m a little concerned that they are looking at the wrong thing. Like deaths, which is a lagging indicator. Deaths is what you get
for last months fuck up. Deaths is also demographically dependent. They also measure silly things like Number of tracers. tracers per 100K is a metric for reopening in the US.
That is a HEAD COUNT approach, which means you can hit the metric by hiring, NOT BY ACTUALLY DOING THE JOB. really bad from a Operations excellence standpoint. you dont care about the heads, you care about the output.
So you want to meter your system by 1) contacts traced, contacts actually tested, and
CLOSURE of epidemiology links. Korea closes 80-90% of cases. They report this metric.
they work to improve this metric. I cant find how many tracers they have, because the number doesnt matter. you can only improve what you measure. they dont report head count, they report
cases resolved. if that takes 30 tracers per 100K, fine, 15 fine, 300, fine. head count is not
some magical number. They focus on case closure.
Closure means: Dude tests positive. you tie him to PREVIOUS CASES 80% of the time.
Not sure if there is a magic number, but at 80% they are successful.so you measure THAT
not head count.
So the CDC has given metrics that really dont allow you to build and monitor and improve
a “test, trace, and isolation MACHINE.” which is what you need for containment.
They look to be instrumenting a process for mitigation. Control deaths, control ICU.. etc.
rather than building a machine to contain the spread.
Still reactive.
Personal communication with Eric Winsberg (who’s not happy with the whole ordeal) made me find this:
I would think that with data on how many people in ICU and knowledge of the harvesting rate
weekly deaths ought to be easy to forecast.
count deBody
Kinda off topic, but if you are bored
From the director of parasite
The UK quarantine rules start on the 8th of June.
On the same morning (23rd May) that the plans were announced the news also had drone footage of mass graves being dug in Sao Paulo, Brazil.
On the same morning the flightradar site showed a plane arriving from Sao Paulo into Heathrow…
Mask deniers,
might read
https://fightcovid19.hku.hk/hku-hamster-research-shows-masks-effective-in-preventing-covid-19-transmission/
There are now places in the US refusing to admit people WEARING a mask.

This seems deserved….
In a way the public health people have it even worse that the climate people, because their work is all about tail risks that happen extremely infrequently (once per century) so the control measures are almost always excessive in hindsight. But not always always.
At least a fair fraction of the climate stuff is gradual and observable.
The NYT issued a correction:
Some updates. I’ve rerun the IC code and set the RO to be 3.5 (to better match the initial phase of the infection). I’ve also changed it to set the number of deaths at 74 days, rather than 65, and – consequently – am only considering the case where interventions were to start a week earlier. Results essentially the same.


I’m also now doing boths run off the same build, which fixes the issue with the initial phases not being the same.
I’ve also done a run where some of the interventions start earlier (CI and HQ), rather than them all starting on March 23. This slightly reduces the impact of the late start, but not by a huge amount.
ATTP
Good stuff.
“I’m also now doing boths run off the same build”
Does this mean you’re generating a network, then reusing it? Curious because network generation was the cause of the supposed “non-determinism” of the model. The code didn’t bother serializing network generation to the point where the same seed will generate the exact same network (though the network will satisfy the parameterized statistical properties). Apparently guaranteeing that the same network will be generated form the same seed makes it run too slowly, and for production they generate one network and use it repeatedly for different intervention scenarios anyway.
Also, the jump in the actual data at around day 95 … is this when the UK began reporting out-of-hospital deaths? At least that’s my interpretation of what James Annan was talking about on April 29th:
ATTP
No, April 29th was well after the time of that little jump in your plotted black real data points.
dhogaza,
I think it does generate a network and then reuse it.
The jump is because I’ve misread some of the lines in the data files. I’m fixing that now.
ICUs matter:
https://www.cbc.ca/news/world/yemen-coronavirus-health-system-1.5579982
Okay, fixed the problem with the data and have rerun the model.
ATTP
That’s very nice.
@ATTP
Here are my results (linear scale). It looks like you fixed the timing issue – just by adjusting R0?
Clive,
In the preUK_R0=2.0.txt file, there’s a parameter called “Number of deaths to accumulate before alert” and “Day of year trigger is reached”. As far as I can tell, these essentially set a target number of deaths to occur by that day (although it doesn’t seem to be exact, and I may not fully understand this). At the moment, this is set for day 100, which is probably why all your runs seem to coincide on that day. This probably means that your week earlier has more deaths than it should have (i.e., the model is forcing the infection to start earlier), while your 1 week later may have too few (the model is forcing it to start later).
What I’ve done is vary the number so that the baseline intervention case roughly matches (by eye) the data, and then used that for all the other runs. I’m also now running them all off the same build (I’m just creating new parameter files and increasing the number of elements in the root array in run_sample.py).
I should have added that I’ve shifted the day from day 100, to day 74, and the number of deaths from 10000 to around 35 (IIRC) for RO = 3.5.
Thanks !
I wasted a few hours trying to fine tune the change day parameters for each intervention in p_PC7_CI_HQ_SD but they are simply dependent on preUK_R0=2.0.txt.
Gay clubs in Iteawon, cluster climbs to over 200.
reading about the chains of transmission is fascinating. club to restaurant to taxi driver, etc
chains 6 deep.
Now, because club goers gave false info to club owners, the city will
get a new system
@ATTP
I think that the target value of 10,000 deaths on day 100 is because this corresponds to the real number of deaths as recorded on 10th April.
In other words Ferguson seems to be calibrating the model so as to agree with this figure on that date. So when we change the lockdown start date all results agree on April 10 ( My birthday).
Pingback: Did the UK lockdown too late ? | Clive Best
Clive,
Yes, I think that’s right. If you leave the target date as day 100 (April 10) then they will all agree on that date, irrespective of the date on which interventions start. This can then be unrealistic, because earlier interventions may not reach 10000 deaths, and so to match this target date, the model will then assume that the infection starts earlier when the interventions are earlier.
However, in their Report 9 they claim to have used a target date of March 14, so the target date of April 10 in the public version may not be the same as what they used in their first report.
My prediction is that they don’t want to release the code/parameters for the real, uncalibrated runs that were shown to SAGE.
On March 14th (day 74) UK had 24 deaths
Clive,
Yes, but I don’t think that parameter sets an exact number. Also, I’m trying to set it so as to best fit the overall data (my simulation with interventions starting on 23 March had 31 deaths on day 74). It is stochastic, so I should probably be running an ensemble of simulations, but our cluster is about to go down so I probably can’t do anymore at the moment. Also, given all the ones I have run it doesn’t seem to much change the overall comparison between the two scenarios (i.e., it always seems to end up being that starting a week earlier would have reduced the number of deaths by ~75%, bearing in mind that this assumes that we do nothing before implementing lockdown).
For those interested in the sociology and philosophy of science, I’ve just been reading “The Trouble with Physics” by Lee Smolin,and found the last few chapters (which were about the sociology of string theorists and the philosophy of science) very interesting. Of particular interest is the number of times he talks about consensus, both as the goal of science* and of being the method by which science makes progress. I think I may keep a quote or two handy for the “there is no place for consensus in science” climate skeptics ;o)
Most of the rest of the book is concerned with the lack of falsifiable predictions make by string theory, which is a bit like Sabine Hossenfelder’s book, but more moderately stated (which appealed to me more as a result).
* this ought to be a bit of a no-brainer; if the purpose of science is to discover objective truths about the universe are we supposed to disagree about them when they have beenestablished?
oops, the link should have been to this image
“These simulations are intended to be stochastic. The code uses random numbers to represent the probability of an outcome given some event (for example, a susceptible person contracting the virus if encountering an infected person). Different runs won’t produce precisely the same results, but the general picture should be roughly the same (just like the difference between weather and climate in GCMs).”
Why?
Also
“overall comparison between the two scenarios (i.e., it always seems to end up being that starting a week earlier would have reduced the number of deaths by ~75%, bearing in mind that this assumes that we do nothing before implementing lockdown).“
This is a mathematical certainty, not a realistic implementation scenario
dikanmarsupial — Yes, scientists disagree about concensus science, often based on new evidence. The most famous is the shift from geocentrism and epicycles to heleocentrism and Kepler ‘ laws.
Another is a current argument about ecosystem stability depending upon diversity. A recent theorem states that simpler ecosystems are more stable. This is highly controversial.
David, Smolin is arguing that consensus is desirable and an essential part of the sociology of science. Of course there will always be contrarians and that is mostly a good thing*, because very, very rarely it turns out they are right. The point is that those who claim that there is no place for consensus in [climate] science are simply wrong, and Smolin provides a nice example from outside climate science and an interesting discussion.
* the problem arises when they reject statements that are very well established and do so with faulty logic and can’t/don’t accept their errors when they are pointed out to them. At that point they should expect to be marginalized from serious discussion, at least until they start taking criticism seriously.
BTW I think Smolin mentions Kepler as an example of the difficulty of determining what science actually is. Apparently he made some key contributions to astrology as well as astronomy, and it isn’t that clear to me that his work on “Harmonices Mundi” is really science (or that Gioridano Bruno’s theories are less “science”). It seems to me that string theory is a bit of “pre-normal science”, where people are casting about for ideas, a bit like Kepler, it just hasn’t quite found the inspiration to move forward into “normal science” as Kepler did when he introduced eliptical orbits (although Kepler carried on being imaginative rather than “merely” concentrating on “normal science)?
dikanmarsupial — More lively when concensus fails. A current complete lack of understanding is dark matter. Assuming Einstein’s General Relativity, indeed there’s no reason to doubt it as it passes every test, about 85% of all matter is the extraordinary dark matter. It fails, so far, to interact with ordinary light & matter in each & every experiment.
Thus the so-called Standard Model of Physics leaves something out. String Theory won’t put it in.
Yours in mystery,
David
David B. Benson “More lively when concensus fails.”
yes, conversely more tedious when contrarians continually repeat the same old canards and then say “there is no place for consensus in science”. The problem is that “lively” is rare and “tedious” is all but ubiquitous.
Of course this is just distracting from the point I was making, which is that science is very much about consensus..
dikanmarsupial — On the contrary, science is about establishing truths about the cosmos. On some facets there is concensus. Then scientists go on to other facets.
Contrarians are merely the ignoranti, unwilling to learn the established science.
“On the contrary, science is about establishing truths about the cosmos.”
if we find some, should not we agree on them then? ;o)
Science is indeed about establishing truths, which are things we all ought to be able to agree on. That is why science exhibits paradigms (which are groups of statements on which the research community has reached an consensus). Consensus is part of how science moves forward as it is how we define the “established science” that contrarians are unwilling to learn (I don’t think that true BTW, at least not uniformly).
dikanmarsupial, agreed.
Except about Contrarians. They might know some “facts”, but are unable to apply the requisite logic.
angech wrote “Why?”
because that is how Monte Carlo simulation works. I can strongly recommend Henk Tijm’s book “Understanding Probability: Chance Rules in Everyday Life” which teaches probabilistic reasoning via simulation.
If we had an infinite amount of computer time, we could average over all possible simulations and get a perfect representation of what we know and what we don’t, but sadly computational power is finite, so we often have to make do with a small number of model runs, each of which will be slightly different in some way.
Without consensus, every science paper would literally fill many of these shelves:
when watching the world science panel sessions with scientists who clearly have differing views e.g. Brian Greene – String Theory and Sean Carroll – Many Worlds, i am always impressed by the civility of the discourse and the mutual respect they have for each other
that’s how it comes over anyway
although thinking about it there was one where there was a guy on the panel spouting crap – that clearly irritated the rest of the panel – and it was on a fundamental consensus issue from memory
an_older_code Smolin’s book suggests that they are not always that polite, but then again individual accounts are not all that reliable – if you only looked at Roger Pielke Jr’s account of the climate science community you would get an account that is severely at variance with my experience.
Audits never end:
Willard, being a resident of the Pacific Northwest, I didn’t understand this
AT’s is a blog located in (*looks around, sees no Scot*) UK, David.
Here’s a recap:
https://www.manchestereveningnews.co.uk/news/uk-news/government-lockdown-tweet-dominic-cummings-18306924
Otherwise search for “David Cummings fiasco.”
958
We’ve discussed mask-wearing here in the past, and Willis likes to come here and drop of his pearls of wisdom…so…
So after mask-wearing has become a symbol of the ideological war here in the US, our friend Willis puts up a post where he selectively excerpts information on mask-wearing (he only quotes information that says it’s not effective)..
He also says:
When infectious people cough, the virus escapes into the environment, mask or no mask. No surprise to me. No simple mask is going to be able to contain a cough or a sneeze. It just blows out all around the edges.
So I says to myself, “Self, isn’t this completely different than what Willis has said in the past?” And I looked, and sure enough it is.
Here is what he has written before:
And
> Wash your hands, don’t touch your face, no making merry with naked pangolins, wear a mask, stay well dear friends,
And
>> And of course continue to follow the usual precautions—wash your hands; wear a mask at normal functions and not, as in your past, just at bank robberies;
And
>>> Protect the most vulnerable, quarantine the sick rather than the healthy, wash your hands (particularly after handling pangolins), wear masks, in social situations stay six feet (2 m) away from bats, and let’s move forward no matter what our self-proclaimed overlords have to say about the matter.
———————————–
Now it’s kind of funny ’cause Willis has this thing about quoting what he says when you disagree with him. Now that’s an entirely reasonable thing to have, and so I quoted what he said in a comment, and I (sarcastically) asked him to account for the contradiction in what he has had to say on the topic. And despite me QUOTING WHAT HE SAYS he deleted my comment, and then he actually said:
I love me some Willis.
Some are keen that some audits end sooner rather than later
https://www.bbc.co.uk/news/uk-politics-52814815
I suspect there is a good chance the media will get bored of this one and let it go.
The thinking behind easing the lockdown…

Henk Tijm’s book “Understanding Probability: Chance Rules in Everyday Life”
Will check with my bookseller.
Could buy on Amazon but gives him a little income in these hard times.
Ta.
(Reassuringly, they did not trace any clusters to Japan’s notoriously packed commuter trains. Oshitani says riders are usually alone and not talking to other passengers. And lately, they are all wearing masks. “An infected individual can infect others in such an environment, but it must be rare,” he says. He says Japan would have seen large outbreaks traced to trains if airborne transmission of the virus was possible.)
@dikranmarsupial, indeed
and the counter factual from the trawling of 30,000 climategate emails was just how little disagreement they found amongst the scientist
I would imagine you would find more disagreement/bitchiness if you hacked into the Women’s Institute email server
@-older-code
“I would imagine you would find more disagreement/bitchiness if you hacked into the Women’s Institute email server”
Or for groups that mirror better the gender disparity in science;
The baseball and football forums
Related article:
https://ftalphaville.ft.com/2020/05/21/1590091709000/It-s-all-very-well–following-the-science—but-is-the-science-any-good–/
“and the counter factual from the trawling of 30,000 climategate emails was just how little disagreement they found amongst the scientist ”
I gather in one case it was me ;o)
Plenty of disagreement among most groups scientists, it is just that generally it is polite and constructive disagreement.
… and generally over details rather than fundamental flaws in basic physics that has been reasonably well established for a century.
@izen
Yes point taken
A lazy analogy
Atul can’t entise anyone to comment on this article?
–snip–
The question is: is any of this true? Did the modelling, as the Daily Mail put it last Saturday, “single-handedly (trigger) a dramatic change in the government’s handling of the outbreak”? If the code is so bad, does that render the modelling useless? And would shoddy modelling remove the justification for the lockdowns in place across much of the globe anyway?
https://ftalphaville.ft.com/2020/05/21/1590091709000/It-s-all-very-well–following-the-science—but-is-the-science-any-good–/
Joshua: no. It’s been publicly stated that the decision was based on a range of sources, and that dozens of epidemiologists were consulted in the UK, not just Ferguson’s group. Who only modelled a few countries anyway.
The Mail no doubt says climate models are crap too. ATTP’s calibrated runs match pretty well IIRC. Obviously if you get a wrong R number initially, wrong asymptomatic rate, wrong assumption about self-isolation compliance (50% according to SAGE) you get a “wrong” result. That’s a data problem, not a modelling problem.
No credible study has shifted the infection fatality rate far from 1%. UK herd immunity needs about 50 million infected, 500,000 deaths follow as night follows day. Pretty damn fast with that three-day doubling rate we had. As with AGW, the basics are very simple. The rest is just detail. No-one, not even Sweden who went for herd immunity and knew they had to shield the vulnerable, has managed to shield the vulnerable for a couple of months, let alone six. And the same again next year. That was always a pipe dream.
Another take on the troubles with so-called particle physics:
https://plato.stanford.edu/entries/quantum-field-theory/
Little said about string theory, but incisive there as well.
Possibly the best COVID-19 model yet:
https://medicalxpress.com/news/2020-05-peaks-covid-pandemic.html
Closed form solutions to the SIR epidemic model:
https://phys.org/news/2020-05-scientists-method-epidemiologists-covid-.html
Joshua:
“If the code is so bad, does that render the modelling useless? ”
Are you asking that rhetorically? 🙂
You’ve seen a lot of commentary on my part regarding this. The “code is so bad” meme is just crap. The model part of the model (the mathy part) is fairly cryptic in the sense that short, non-obvious variable names are often used, and the algorithms aren’t described in the code itself, and are opaque without appropriate context (domain knowledge, in part).
But, all of those so-called code experts should know that high-level design documents are generally put together for commercial software before it is written, and more formally detailed specs often (but not always) are, and none of this appears in the source files per se. The academic papers published by ferguson are the high-level description. This includes the paper published describing the 13 year old model used to estimate how many doses of tamiflu combined with various isolation strategies it would take to exterminate a new, deadly flu variant crossing from an animal to one human, then spreading person-to-person, in some rural area of Thailand (yes, I’ve read it, quite interesting).
Anyway, the whole code quality argument is, once again, a strawman.
Side note: over at github, the ideologically-driven types who were filing content-free issue tickets along the lines of “the code is crap!” seem to have disappeared. What has happened, which restores my faith in the world a bit, is that a small number of people are eager to actually help, including some with modeling experience. And the MSFT development team are encouraging them to submit change requests to help clean stuff up. A couple of genuine multiprocessing race conditions were found, for instance, though in a section of the code inherited (I imagine) from the model as used for the flu that deals with vaccination effectiveness, disabled at the moment for what I hope is an obvious reason. The team was grateful for the bug being found, because it will save them a headache once vaccination modeling is enabled.
As Dave Geologist says:
“ATTP’s calibrated runs match pretty well IIRC”
Proof’s in the pudding, as they say.
“Obviously if you get a wrong R number initially, wrong asymptomatic rate, wrong assumption about self-isolation compliance (50% according to SAGE) you get a “wrong” result. That’s a data problem, not a modelling problem.”
Which exposes the REAL problem with the people screaming that lockdown was unnecessary.
The REAL problem is that the modeling effort, using an R number too low and a doubling time too long, UNDERESTIMATED the number of deaths that the UK would suffer after imposing various possible interventions on a particular date. If anything, these underestimations of reality, expressed in the model parameterization, were partly responsible for the government waiting so long to take action. Underestimating R0 means that the no-intervention fatality estimate was too low, too, though as they said when they published their 500K number, the no-intervention scenario would never happen.
Never forget – and don’t let those attacking the modelers for being responsible for an unnecessary lockdown forget (or lie), either – that the full lockdown estimate from the IC model was for about 20K deaths. R0 too low, doubling rate too long (leading to an underestimate of how many people were infected for various possible intervention dates). With a realistic estimate of R0 the model tracks reality quite well, and reality is about 36K deaths.
“No credible study has shifted the infection fatality rate far from 1%. UK herd immunity needs about 50 million infected, 500,000 deaths follow as night follows day. Pretty damn fast with that three-day doubling rate we had. As with AGW, the basics are very simple. The rest is just detail.”
Indeed.
David B Benson
“Possibly the best COVID-19 model yet”
Other than a natural assumption that physicists do it better, why?
If I’m interpreting their graphs correctly, the actual data ends on May 8th (green). How have those projections held up? Any information on that?
To add to what dhogaza said, the pressure/reward system that governs how scientists operate actively discourage a focus on code quality. We are rewarded for getting research grants, for publishing papers and having “impact”. For most research projects, the only people that see/use the code is the research team themselves, and the pressure is always on to get the new grant or publish a new paper. If society wants good code quality in science, the solution is simple – fund it and stop expecting scientists to do more and more with less and less resource. There is no reward for scientists in providing code quality higher than they need for their own work in the vast majority of cases. It doesn’t come free, and there are substantial costs in maintaining old code and providing support.
As I tell my students, ALL software is written to a budget, and part of being a good programmer is about acquiring the judgment to reach the best compromise between the software qualities we want (e.g. correctness, efficiency, reliability, maintainability), the priorities of which vary from one programming task to another, while staying within that budget.
There are many science fields where code validation+verification is a big part of what scientists are paid to do; this fits better within national lab cultures than university ones, and causes some grumbling.
So ‘code quality’ is actually taken seriously: at least in the big-picture sense of ‘does this give the right result?’. Obviously, people don’t care about it looking ‘pretty’ or ‘modern’. Bare-metal FORTRAN-style code (often, literally actual FORTRAN) is pretty much normal. Crunching numbers usually doesn’t require anything fancy, and things like object-orientated code often just gets in the way.
At least in the UK, the idea that there needs to be a significant effort in improving research code and the skills of the people who do it has been backed with a decent chunk of money: there are a bunch of ‘Research Software Engineers’ who have been funded to do exactly this.
But as dhogaza+Dave said above, this is a complete distraction here: it is the data that goes into the model that matters here, not the length of variable names. You don’t even need a back of the envelope to figure out that with that data, almost everyone gets infected, and mortality is unacceptably high, unless you do something pretty drastic.
Seconded, dikran. And it’s not new. My only bit of code that’s out there was written early in my career at a government agency. Various structural geology manipulations taking advantage of computer graphics advances. I didn’t have a dedicated graphics card or array processor, but all the number crunching was done using arrays and homogeneous coordinates. I was surprised to find that it was the exact same maths you’d find in Ramsay’s 1967 textbook, except he did it all by analytical geometry. Taking a shape and deforming, projecting or translating it. I thought, great, analytical geometry makes my brain hurt and I can avoid that by just reading a few computer graphics papers. I was already primed for that because I’d done some unrelated work, following the approach of Hans Ramberg who was doing it all by matrix algebra even before computers made that the smart way to go.
I had some entertaining ding-dongs with my supervisor who was very much of the Ramsay school, and had published in that area but as proof-of-concept using analytical geometry solutions. Reminiscent of some of the discussions we’ve had here over closed-form vs. numerical solutions to a problem. A mix of “but that’s cheating” and “but what about numerical artefacts”. My brain hurting wasn’t a valid excuse, but I was eventually able to persuade him that his approach wouldn’t scale, because you had to call costly series approximations of trigonometric and transcendental functions as opposed to just adding, subtracting, multiplying and dividing. And it was hard enough already, time-sharing on a PDP with 7 usable bits, and needing double precision everywhere because geology tends to involve small changes in large numbers. And in any case real geology is inhomogeneous, so in the end if you want an averaged, integrated or representative solution you have to bite the bullet and go least-squares or moving-average at some point.
The intent was to open-source it (in the early 1980s!) as a pilot or demonstration in the hope of encouraging UK SMEs to get into the O&G software business. It was on-request from a government store so I presume it was not fully open but had restrictions, perhaps free to UK owned companies only (I got a copy for my later, UK-owned employer). I like to think it was used, although the code was pretty crappy (inefficient/inelegant). I was actually diligent about commenting it, knowing how it would be used, and put a lot of effort into not taking advantage of all the nice things that were available in DEC FORTRAN but not in Standard FORTRAN 77. Anyway time had moved on and compute power meant you could do a lot more than I had even tried. But as software got bloated one UK SME released a ‘lite’ version of their software which went back to basics and effectively did what I’d done a decade earlier. A couple of years previously I’d been contacted by my former employer asking if I still had the VAX archive tape they’d sent me. Turns out they’d had a request to check out my software from that SME, but their own tape was unreadable. I said yes, and how about you send me a copy back on Unix Exabyte that I can read.
Anyway to return to the point, there was no real support for documenting and QCing the code, other than my diligence and my supervisor’s comments. I did write a report describing what each module did and why, and another on what I was trying to do, why it was relevant, what was the maths behind the code, and ended with a full-scale worked example. And went on to run it on another internal project. Ah but, you say, that contradicts my original claim. I did get funding (time) for clean-up and documentation. But… that was internal to my agency and to the industry/energy department sponsor. So it was more like a commercial software project than an academic one. My agency reported back to the same UK research organisation (NERC/SRC/SSRC or whatever they’re called these days) that funded academic work. And promotion panels were taken from the broader organisation, not the agency. So all the questions were “what about your peer-reviewed papers”. Internal reports don’t count. Code doesn’t count. I had some unrelated PhD work published by that time, but “not relevant to your current job, part of your previous career so that can get you recruited, not promoted”. Fortunately my boss was understanding and found time for me to turn some presentations I’d done at computing/mathematical geology conferences into external publications. Actually it was mostly my own time, but computer and drawing-office time was essential, and support to get suitably cleaned proprietary data released.
Wow, that’s more long-winded than I intended, but the TL;DR version is that “only published papers matter” was already a Thing in the 1980s.
dhgoza –
>Are you asking that rhetorically?
You did read the article, no?
I was curious if people might respond to what’s in the article…oh well…
Dave_Geologist, Just goes to show you what caveman mentality goes into scientific software development. Having spent 20 years writing real-time multi-threaded Ada software for visual simulators, there are a few of us that understand what’s actually involved .,,, just ask Mosher.
@-Joshua
“You did read the article, no?”
No, you have to register.
I didn’t read the alphaville article either for the same reason.
But I think the general question of what we should expect in terms of scientific software quality, and how to incentivise better science coding, is much more interesting than stupid nitpicking about the Imperial model code.
Ben –
> is much more interesting than stupid nitpicking about the Imperial model code.
That’s not what the article is about.
There was a follow-up to the LA county serology study. 2.1% tested positive May 8-12. This is a drop of more than a factor of two from the original study (4.6% April 10-14).
The ‘explanations’ offered by the PI are amusing.
https://losangeles.cbslocal.com/2020/05/20/la-county-still-far-away-from-herd-immunity-new-antibody-numbers-show/
> “If you pooled the results across the two waves…
That’s a remarkable statement.
Ben said
> “… is much more interesting than stupid nitpicking about the Imperial model code.”
I browsed through the Imperial code and came to the conclusion that (a) it’s OK in terms of software skill and (b) it’s delusional in terms of scope.
If no one else in LA County dies, that puts the IFR at 0.75%
I wonder if Ioannidis will launch a national TV publicity campaign to explain why is research was wrong?
“No, you have to register.”
That is also the reason I didn’t read it, but then again the material with the link suggested it wasn’t very promising anyway.
“Dave_Geologist, Just goes to show you what caveman mentality goes into scientific software development.” ”
No, the point is that software is written to a budget and you have to spend effort where it best achieves your goals. These are different for different applications (or branches of science). If you ignore your budget and are not productive because you spend all your time on pointless sofwtare engineering that nobody will notice because you never produce the papers, that is a bit of a career limiting move.
“Having spent 20 years writing real-time multi-threaded Ada software for visual simulators, there are a few of us that understand what’s actually involved .,,, just ask Mosher.”
Yay, software engineering snobbery. Steve Easterbrooks work on the software engineering in GCMs is well worth a read/view. There is no point being a good programmer if you don’t understand the science well enough to know what to program.
The material in the link was a setup. It was a rhetorical question. The thesis of the article ran quite different.
i read it “meh” is about all i could say tbh
although it contained this interesting link
albeit similar to what has been discussed about the pearl clutching criticisms of “da code” here
“The material in the link was a setup. It was a rhetorical question. The thesis of the article ran quite different.”
Sorry, not impressed by that sort of thing.
an_older_code – thanks, I found it an interesting read as well.
FWIW in my field (machine learning) there has been a move from coding your own models to using frameworks written by others (scikit-learn, keras, tensorflow, pytorch) etc, which of course do need more software enigneering. While this means it is possible to code up some very impressive things fairly quickly, I do wonder if something is lost in this approach. There is also, from what I have found, a bit of a documentation problem, unless you like learning everything from examples (which I personally dislike – I’d rather have a book that set out the principles and architecture of the software, but that is partly as I’d like to be adding to the framework or adapting it, rather than just using it).
dikranmarsupial said:
Are you asserting that is the case? I can give many counter-examples where the development does not follow a budget, starting with many parts of the GNU suite of software.
> Sorry, not impressed by that sort of thing.
No need to apologize. I don’t take it personally.
“I can give many counter-examples where the development does not follow a budget, starting with many parts of the GNU suite of software.
Budgets are not only financial, they also include time and energy budgets. For the production of scientific software there often isn’t an explicit financial budget (for example it is not unusual for faculty contracts not to include specific contracted working hours, but there are still only 24 hours to a day and seven days to a week). This means in practice there is always a limit to the effort that can be expended in achieving any aspect of software quality, and a good software engineer will allocate their time and energy where it will best accomplish the best available trade-off.
Thanks for the link an_older_code. Couldn’t agree more. I don’t know if it was the same source but I gave up a third of the way through a similar hatchet job when it was clear the author hadn’t a clue about numerical methods or stochastic modelling. Decades of experience at a software giant or not, in this case (s)he was a monkey with a typewriter.
It’s annoying for outsiders when they’re told “I’d know a stupid result when I saw it; and anyway my peers or my students/post-docs would catch it”. Or “this doesn’t matter, but those three things you’ve ignored really, really matter”. Especially when, in order for the outsider to replicate that sort of validation, they’d have to spend years learning a new field and that would include going back to school for stuff they didn’t take past GCSE let alone A Level. Especially if your objective is not to learn about or contribute to the field but to perform a politically motivated hatchet job, on time and to a budget (even if the budget is unlimited, the time is not because in order to thwart public-safety policy, you have to strike while the iron is hot).
I think that many of the ‘software engineering’/’code quality’ standards in the commercial world can actually help in scientific software development.
Not, of course, in the sense that it will turn out that ‘all the models were wrong’. And people will still do trivial nitpicking if they don’t like the result.
But because it will enable/ease reuse and reduce the learning curve in trying to figure out what a code does, and what regime it is reliable in. It isn’t that uncommon for multiple PhD students of the same supervisor to rewrite a code that does exactly the same thing (and not just trivial scripts).
Basically, scientists can and should do better coding. And that will mean adopting some industry standards/practices where appropriate. This is already happening in many ways, with the adoption of better revision control and automated testing in many cases, as well as funding specifically targeted at software engineering improvement, and validation and verification.
This stuff is slowly changing, so although there are people still coding like it’s 1975, there are also many doing better.
Ben wrote “I think that many of the ‘software engineering’/’code quality’ standards in the commercial world can actually help in scientific software development.”
I don’t think anyone would really disagree, the point is that it involves a cost, even if it is just tin time and energy. If society wants better software engineering in science, then society needs to either bear the costs of better software engineering, or accept a reduction in the productivity of scientists as measured by currently applied metrics (i.e. the reward mechanisms need to be changed).
I don’t think there is much evidence that the current standards of software engineering are not indicative of a near optimum compromise under the current reward structure. It is what we are implicitly being told to do.
“reduce the learning curve in trying to figure out what a code does”
This is part of the point made by the article, in the majority of cases, the code is only ever understood by the person that wrote it or other people in their research group. Thus time spent on making the code easier to learn is time wasted.
” It isn’t that uncommon for multiple PhD students of the same supervisor to rewrite a code that does exactly the same thing (and not just trivial scripts).”
Yes, it is a really good way of understanding the underlying science, and a good way of replicating results in a meaningful way (i.e. a test of whether the software does what it is supposed to do, rather than just that the results are reproducible. I do worry that a lot of students who rely on frameworks end up not really understanding the algorithms and hence encounter unexpected pitfalls in their application.
BTW, the Steve Easterbrook work I mentioned earlier was previously discussed on this blog here.
Perhaps so many scientists do their own code because it easier to teach coding to scientists than to teach science to coders.
Actually Ben, I’ve been external examiner to two PhD students who did rewrite code that does exactly the same thing. And it wasn’t a trivial script. You’d pay thousands of pounds per seat per year for commercial software that does the same thing.
They applied it to two different sedimentary basins, and I asked if the second one was just re-using the existing code because then the effort would have been much less and it could just have been button-pressing. No, said the student, he wrote his own from scratch, and tested it against his predecessor’s results. The supervisor said they always do that. It’s part of the learning experience and demonstrates that the student understands the physics and is not just a button-pusher. That’s another difference between research (at least PhD research) and commercial coding. It’s training and qualification for a future career, not just research for science’s sake.
I was pleased because it was my alma mater and I’d been subjected to similar discipline two decades earlier. While I did use library code from SPSS and pre-written ZAF correction code for XRF and electron microprobe, I had to learn how it all worked well enough to prepare and present a lecture or two to the final-year undergraduate geochemistry option (which of course is also training). I can still remember the physics of a microprobe and how and where it was developed*. Even Castaing’s name stuck with me. Now that’s something – invent a whole new technology for your PhD! It helps if you can make word associations – the SiLi detector** was a Silly Detector 🙂 . If I put my mind to it I can probably remember why the X-ray count roughly scales to weight % and not atom % as you’d expect for a single-electron quantum process. Self-absorption and secondary fluorescence IIRC. Actually now that I’ve thought of it there’s probably an analogy with CO2 in the atmosphere. If the atoms were so far apart that the X-ray could travel straight to the detector with no interference, it would be atom %.
* The many weeks I wasted trying to convert an old metallurgy-department probe to work with rock slices is probably also a factor. Transmission microscopy in a non-conducting material vs. reflection microscopy in a conducting material. Aborted because to be practical we also had to add energy-dispersive detection and the expected money for that dried up.
** A CCD, like in your phone camera, but for X-rays. I googled and nowadays they’re thin-film rather than single-crystal, presumably using something like solar cell technology.
Entropic Man – indeed, more people want to know how to program than want to learn maths, which is a pity as the combination of the two greatly expands the range of interesting problems you can write a program to solve.
Dave “It helps if you can make word associations” but not without it’s dangers, c.f. copper nano tubes. ;o)
I disagree that the current situation is really ‘optimal’ in any sense, even in terms of the existing incentives. And researchers are not just passive sheep following incentives. They have a big part to play in leading and setting the agenda.
It isn’t really good enough or vaguely realistic to ask ‘society’ to drive this: that just sounds like an excuse for doing nothing and not taking responsibility. A better approach is to support improved software standards and campaign through funding councils for the needed resources.
Reminds me of the lazy self-serving arguments defending the status-quo in other areas: if renewable energy is so great, why isn’t it dominant already? If public transport is so great, why is there so little of it? There is a lot of inertia, particularly from people who have been coding since the 70s: as usual the status quo is actively maintained by those at the top who don’t like or want change. It isn’t all just external conditions. This is a question of culture within science fields.
Usually doing code well is lower effort in the medium and long term and a lot of poor coding results from lack of awareness that there is a better way to do things. It is like doing experiments carefully and methodically: faster and better in the long term, and leads to higher research productivity.
Obviously, how far to take all this stuff depends a lot on the scale and purpose of the coding project.
“I disagree that the current situation is really ‘optimal’ in any sense”
Do you have any evidence
“It isn’t really good enough or vaguely realistic to ask ‘society’ to drive this”
That is not what I am saying, I am saying that if society wants better software quality, then they have to resource it. If more resource is available, then scientists will be able to improve the quality of their software – it is something most want to do, but it isn’t the only thing they want to do – generally the thing they want to do most is the science. It is resource limitation which currently governs the compromise. Academic research is not well resourced.
” A better approach is to support improved software standards and campaign through funding councils for the needed resources.”
and where do the research councils get the resources to distribute? From taxation (i.e. society). As it happens, IIRC that is precisely the measure I was suggesting on the previous thread, although rewarding it via REF/RAE would be another approach.
Coronavirus sources:
https://www.smh.com.au/world/asia/wildlife-markets-are-the-tip-of-the-iceberg-and-not-just-in-china-20200529-p54xks.html
I certainly hadn’t known about this…
“And researchers are not just passive sheep following incentives. ”
show me a researcher that doesn’t seek incentives (e.g. grants) and I’ll show you a researcher that is unlikely to prosper in modern academia (ISTR Peter Higgs having some interesting views on that).
Researchers are indeed not passive sheep, they are intelligent people with research agendas that they want to pursue. Naturally they will seek resources for this and they will make the best use of those resources they can – and being intelligent are generally fairly good at that. That is why it is reasonable to expect issues like software quality, which are not a primary goal, to nevertheless represent a good compromise between the competing aims and objectives of the researcher.
dm: ouch! 😦 I presume since they’re all Chinese, English is not their first language. And their dictionaries or language courses are too polite.
Although I remember from my high-school French classes that coming in with French swear-words was something of an informal badge of honour 🙂 .
Dave, indeed, I don’t think the Journal in question had that excuse (and rather let the authors down a bit there)
Zut alors, pour moi aussi!
I’ve been watching a few French films recently, and it is interesting to see that the subtitles seem consistently more polite than what is actually said. Perhaps it is that the phrases in French are not considered as being as rude as their literal translation would be in English, but perhaps people are just a bit more reticent when writing expletives rather than saying them?
@-Dave B Benson
“I certainly hadn’t known about this…”
Until the 70s most UK towns had a wet market once a week selling the local farm animals to the local slaughter houses for onward sale to the local butcher.
The demise of this ancient tradition was not the result of some profound cultural shift, but the technological innovation of refrigeration and the economic dominance of large food business.
You do not need a wet market if all the live animals are transported to a few large meat processing plants and shrink-wrapped for storage in a commercial deep-freeze until sale in a supermarket. When it is put in the customers ‘fridge/freezer.
In other countries, certainly in China and other parts of Asia, such large scale food processing and cheap available refrigeration at the commercial and domestic level is not available. the sale of live animals is the only way to ensure the meat is fresh.
The sale of wild animals was first encourage in China to deal with a serious food shortage. The lack of meat to meet demand in Asia has encouraged the commercial catching of wildlife.
ironically it has also encouraged the commercial farming of bats, civets and other ‘wild’ sources of meat because the authorities reduced regulation and tax of these options to try and deal with the shortage of meat.
The use of certain animals as ‘traditional medicine’ is just a small percentage of this total trade, and would in turn be suppressed by the rise of refrigeration and big industrial food producers.
Whether that is a good thing overall… YMMV.
WHUT:
“I browsed through the Imperial code and came to the conclusion that (a) it’s OK in terms of software skill and (b) it’s delusional in terms of scope.”
Yeah, that thought’s run through my mind, as well. Extremely ambitious would probably be my wording.
On the other hand, properly parameterized it does seem to model the death curve reasonably well.
Unanswered is whether or not it matches reality at all regarding the timing of the geographical spread of a novel, deadly virus, which was what the original research (the Fergusson flu epidemic version of 13 years ago, described in his original paper).
Fergusson does have other papers out on modeling of flu epidemics which I’ve not read, so he might have published some answers as to how well their agent-based approach has worked when dealing with real outbreaks rather than the hypothetical situation modeled when the first paper was written.
Izen
“Until the 70s most UK towns had a wet market once a week selling the local farm animals to the local slaughter houses for onward sale to the local butcher.
The demise of this ancient tradition was not the result of some profound cultural shift, but the technological innovation of refrigeration and the economic dominance of large food business.”
Thank you, thank you, thank you.
I’ve been making the refrigeration point since early on to quite a few of my acquaintances who can’t imagine why wet markets exist. I stayed at a hotel next to a large market that had a wet market portion while in a small town in the New Territories north of Kowloon while birding for two weeks, and have been to a small Ecuadorian town in the Andes that included a weekly wet market.
Lack of refrigeration means fresh (as opposed to salted or dried) meat is easiest kept from spoiling by keeping it alive as long as you can. This is why you found livestock on sailing ships, too.
I must say I was very impressed by how quickly the Chinese vendors could turn a live chicken into something that looked very much like we see in our supermarkets, minus the plastic wrap. No wild animals at that wet market, that’s another misconception many have when talking about the wild animal trade in China, most wet markets are either entirely or mostly for the delivery and processing and selling of domestic animals.
dikranmarsupial:
“Yay, software engineering snobbery.”
Seriously. Though WHUT did follow up by saying (regarding the IC model) “it’s OK in terms of software skill”, I’ll give him kudos for keeping an open mind.
One thing the open source movement has done has been to make public how crappy the code of supposedly professional software engineers can be. Docker internals. Ugh. Parts of it, anyway.
No sure what software engineering snobbery is, but back in the day I advocated for software engineering for many projects, and always faced down the excuses for expediency. Most of the battering I took involved my preference for Ada, and that turned out to stand the test of time with the GNAT Ada tool suite coming out of NYU turning into a secret weapon. Interesting article from last year hosted on the Hack-A-Day web site: https://hackaday.com/2019/09/10/why-ada-is-the-language-you-want-to-be-programming-your-systems-with/
The comments are all expected and fairly typical.
Churches again in Korea
https://www.cdc.go.kr/board/board.es?mid=a30402000000&bid=0030&act=view&list_no=367388&tag=&nPage=1
6 new clusters.
1 big cluster from a logistics center
Oh, I am out of quarantine. tested negative.
inbound cases from travel trickle in at 4-5 per day, mostly nationals returning
~1200 inbound cases ~40% are caught at the airport ( temperature check) and the balance
caught during quarantine. Exiting Korea I was checked for fever 3 times. Exiting the USA?
checked zero times.
“Dave_Geologist, Just goes to show you what caveman mentality goes into scientific software development. Having spent 20 years writing real-time multi-threaded Ada software for visual simulators, there are a few of us that understand what’s actually involved .,,, just ask Mosher.”
That’s hardcore WHUT.
did you follow milStd 2167A/T?
Funny story: after winning a govt contract we were required to redo everything per 2167A/T
So I had to hire guys who got it. My solution was to pair research programmers
with the guys trained in 2167A/T.
Wrong Mosher.
an actual fistfight broke out. The research guy ( a hulking Olympic class velodrome biker)
did not enjoy the process and beat the crap out of the skinny 2167A guy
t2167A/T the bane of my existence
http://www.continuum.org/~brentb/DOD2167A.html
Ada does force you to think a problem through before writing a single line, just the whole
process of developing your types is tough discipline.
And that I think ( based on the fist fight) was and is the problem.
It is hard to do research code with Ada. Partly because you don’t know the domain completely.
The writing of the code helps you to understand the domain. The code writing itself is an exploratory act, especially when stuff doesnt work. you code to help you understand. In contrast with Ada you better understand the domain ENTIRELY before you write a single line of code. just consider the strong typing
Days in the month is not an integer. it is a RANGE 1..31
months is not an integer it is a RANGE 1..12
and so forth.
This is a nice place. No fist fights
“There was a follow-up to the LA county serology study. 2.1% tested positive May 8-12. This is a drop of more than a factor of two from the original study (4.6% April 10-14).
The ‘explanations’ offered by the PI are amusing.”
I remain unconvinced that anyone doing serology testing knows how to do random sampling.
given all the behavioral factors that could play in being exposed to the disease, I wouldn’t even know where to start. Super tough problem. I would not touch it.
witness NY where some neighborhoods are 40%+ infected and others are 2%
how do you begin to design a sampling method? when you don’t even know the factors that
could drive exposure? Heck in Korea I would have to stratify based on religion. do you attend church or not? do you go to the gym? is it a big gym or small gym? windows open or closed?
if you dip your testing stick into the right “pot” you could ( by luck) find 0 or 50% .
meanwhile the CDC is plodding along and may start in June July. I will bet they will not collect sufficient demographic/behaviorial/medical history data to address the sampling issues
Strangely No word in Korea about any serology testing.
I would have thought the WHO would have guidelines, procedures, data collection and reporting requirements and database structures all in place years ago as a part of preparedness?
heck I would have thought our CDC would have had all the data collection stuff in place.
it appears Nope.
“…to make public how crappy the code of supposedly professional software engineers can be…”
Reminds me of two pieces of software I dealt with in one job. The first was a short script someone had drummed up locally to grab data from a data logger. The logger generated data once per minute into its own database, and the script requested that data. The script basically used the following sequence:
1) get system date, remember year.
2) get system date, remember month
3) get system date, remember day
4) get system time, remember hour
5) get system time, remember minute.
6) if minute has changed since last dump, request data and remember minute.
7) go back to 1).
Problem? When you notice the minute has changed in step 6, when did it change? Equal chances, to a first approximation, that it changed between any of the intervals between steps 1-5 (and back to 1). So, when you get the hour at 8:59:59.99 and remember 8 as the hour, and then get the minutes from a new call to system time at 9:00:00.01, and realize that minute 0 is different from minute 59 (the last time you requested data from the logger a minute ago), it’s time to request data from 8:00 all over again.
Unlikely? Well, the chances are 1/5, so about five times per day. Also remotely possible to get the wrong day, month, or year…
Solution? One call to system date function, remember year, month and day; one call to system time function and remember hour and minute; second call to system date function to make sure it’s still the same day, and then process.
Forgivable in a quick-and-dirty script, I guess, but the second piece of software I saw this bug in was a commercial package with a task scheduler that a few times a month would start a daily task a second time, one minute after the first.
Not impressed.
“https://philbull.wordpress.com/2020/05/10/why-you-can-ignore-reviews-of-scientific-code-by-commercial-software-developers/
albeit similar to what has been discussed about the pearl clutching criticisms of “da code” here”
Hmm.
Really doesnt tackle the issue.
While his defense of research code is spot on, he forgets one thing.
This code had a customer.
The government.
So the real question is. What will we require and pay for when it comes to scientific code used to make policy decisions?
Open source epidemic model
https://github.com/PublicHealthDynamicsLab/FRED/wiki
““https://philbull.wordpress.com/2020/05/10/why-you-can-ignore-reviews-of-scientific-code-by-commercial-software-developers/
albeit similar to what has been discussed about the pearl clutching criticisms of “da code” here”
hmm. sorry but it is possible to write scientific code that is understandable
https://github.com/PublicHealthDynamicsLab/FRED/blob/FRED-v2.12.0/src/Epidemic.cc
SM
FRED looks even more ambitious than the IC model, more detailed at least in regard to the agent attributes. Interesting project.
dhogaza said:
I would tend to agree. This style of program could benefit from a rule-based architecture or a stochastic diagram (such as a SPN) where all the busy-work of manipulating data structures would be vastly reduced, I personally would never sign up to work on a project like FRED as it stands.
Well, what struck me with FRED was all the hard-coded strings and age ranges and associated spaghetti logic. I guess I was thinking ideally a lot of that should ideally be in a configuration file. e.g., how does one run a simplified version of this with a single representative type of agent?
Also, noting again that complicated agent-based models differ only marginally from the simplest possible SIR epidemic models for most purposes. The review-type material in this is interesting:
https://arxiv.org/abs/2005.11283
SM “hmm. sorry but it is possible to write scientific code that is understandable”
of course, but that doesn’t mean that doing so is an optimal use of the scientists’ time and energy.
“What will we require and pay for when it comes to scientific code used to make policy decisions?”
This is the problem, we (society) require lots of things, but we (society) don’t want to pay for them (or at least we think that somebody else in society should be paying for them). Bit like wanting Met Offices to provide value to the taxpayer by exploiting their IP and then being unhappy that the data they produce not being in the public domain. You can’t have your cake and eat it.
Just as an example, in a previous millennium, I wrote a support vector machine tool box for MATLAB, mostly because I wanted to learn how all the algorithms work and have a toolbox that I could use for my research in model selection (essentially how to set the parameters for the tools to get them to work as well as possible). It was primarily intended to be used for my research, so the design of the toolbox is optimized for my research, but I put it on my website as well in case anybody else found it useful (which apparently some did). It never got past a beta release simply because my teaching load increased and student numbers on the modules I teach increased which meant my research time decreased, which meant that I no longer had time to work on making my toolbox easier to use for other people, there were always tasks with higher priorities, such as using the toolbox to actually do some research, or writing newer and (to me at least) interesting toolboxes (which I haven’t had much time to work on either).
N.B. the software is object oriented and modular, and fairly easy to use, but of course it could be better.
WHUT
“Also, noting again that complicated agent-based models differ only marginally from the simplest possible SIR epidemic models for most purposes.”
I see no indication that modelers are unaware of this, The agent-based models are designed for purposes that S[E[IR models aren’t particularly useful for. I described the research purpose of Ferguson’s IC model up above.
Steven –
> I remain unconvinced that anyone doing serology testing knows how to do random sampling.
It wouldn’t be so bad if they didn’t try to extrapolate to a more general level, let alone launch a TV campaign to explain how their work is evidence they can use to jump categories and calculate a fatality rate at a national or global level
Dhogaza: think that was me, not WHUT.
Obviously the modellers are aware of this.
But non-experts (ie policymakers and people like me) probably aren’t all aware that even very simple models give very similar results. A bit like in climate sensitivity estimation, where people incorrectly claim that it is all based on giant computer models; I think that is even less true in epidemiology.
Ben said:
That’s why I thought it would be better structured as a rules-based or knowledge-base program. The distinction between data and logic is not sharp at all — what would be a configuration file would look no different than the main program source.
Ben McMillan:
“But non-experts (ie policymakers and people like me) probably aren’t all aware that even very simple models give very similar results.”
You don’t even need an SEIR or SIR model to tell you that you need to get the effective reproductive rate below one to start reducing the number of new cases. 1-1/R tells you that.
An SEIR or SIR model can model how long it will take after you get effective R below one for deaths to drop, how many deaths will accumulate, etc.
They can’t tell you HOW to get effective R below one.
Among other things, this is what agent-based modeling can help with. You can think of effective R at a given point in time (not to be confused with R0) as being an emergent property of the model when various interventions are imposed.
R at a given point in time is an input to an SEIR or SIR model (applied to the S pool), if it changes from R0 do to interventions you have to derive the new R outside the model, then plug it in.
So the claim that “even very simple models give very similar results” isn’t really true.
As to whether or not you need such models to help inform policy decisions, well, clearly not for covid-19. The Chinese didn’t need no stinkin’ models, they just welded people in Wuhan into their apartment complexes and gave them food from time to time. That worked.
I think that might be slightly overstating the case for agent-based models, in the sense that even though the simplest possible SIR model doesn’t predict the effect of interventions, stratified SIR models can and do incorporate that kind of thing.
The real problem is anyway that the input parameters (e.g. typical number of contacts between school-age or working-age people) aren’t well known: R ’emerges’ as a pretty straightforward and non-mysterious consequence of these parameters in either kind of model.
Agree that for covid-19, the correct response should be obvious without a model, but nonetheless they seemed to play a pretty big role in the UK policy debate.
Ben McMillan
“Agree that for covid-19, the correct response should be obvious without a model, but nonetheless they seemed to play a pretty big role in the UK policy debate.”
For whatever reason, the simple data regarding what was known at the time and the implications for the number of cases and deaths required to reach herd immunity wasn’t sufficient, as apparently the more “sophisticated” agent-based model results were the straw that broke the camel’s back, as they say. If the story is being told with any honesty at all.
But it appears that the IC team felt that delaying lockdown a bit would be OK. Oops. Now it appears that Ferguson is saying that they’d missed the fact that people returning from Spain were bringing covid-19 with them, undetected at the time, and that therefore the number of infected people in the UK were higher than they believed, throwing their projections off. Still nothing, apparently, about being so far out on R0 and the doubling time. To this Yank, the whole thing was, and still is, a mess.
Meanwhile the US appears to be beating the UK in our race to the bottom by a wide margin. Looks like we’re going to get a lot of data regarding effective transmission in crowded outdoor conditions in a variety of cities soon.
Some discussion about the Gompertz function to empirically model the declining tails in the current observations. The Gompertz is derivable as a deceleration in exponential growth over time, which is understandable as a growing awareness of the benefit of lockdown or social distancing policies. Search on Twitter and also this thesis
“Modelling of Human Behaviour and Response to the Spread of Infectious Diseases”
.https://espace.curtin.edu.au/bitstream/handle/20.500.11937/51702/Phang%20Piau%202016.pdf
Ah, yes, good ‘ole Open Source FRED …
“you have reached this thread through an outdated version of FRED that is no longer actively supported. The current version of FRED has been exclusively licensed to Epistemix Inc. to handle distribution outside the University of Pittsburgh. Licenses are available for not-for-profit academic and research use, as well as commercial licenses. To obtain a license for FRED, please contact John Cordier …”
“This is the problem, we (society) require lots of things, but we (society) don’t want to pay for them (or at least we think that somebody else in society should be paying for them). Bit like wanting Met Offices to provide value to the taxpayer by exploiting their IP and then being unhappy that the data they produce not being in the public domain. You can’t have your cake and eat it.”
From days in defense. we had policy relevant code. It was recognized as such. It was “validated”
as such. Researchers could take it and modify it all they wanted ( we did a lot of this), but then
the check in was controlled. Everyone was committed to accepting the decisions of the approved code, and the problems with it were common knowledge.
In the beginning, there was LOTRAN. we used LOTRAN because it was accepted because the customer said. use lowtran. Of course the research guys worked on MODTRAN and eventually that became a reality, but until that time we all used LOTRAN.
its funny to look back.
See these models
http://jasp-online.org/model-simulations/
bluemax, esams, brawler, used them all back in the day.
But somebody ( the customer) had to commission the creation of this code. And maybe its time
for researchers to push for funding of policy relevant “branches” of their code.
“FRED looks even more ambitious than the IC model, more detailed at least in regard to the agent attributes. Interesting project.”
““you have reached this thread through an outdated version of FRED that is no longer actively supported. The current version of FRED has been exclusively licensed to Epistemix Inc. to handle distribution outside the University of Pittsburgh. Licenses are available for not-for-profit academic and research use, as well as commercial licenses. To obtain a license for FRED, please contact John Cordier …”
haha.
fork them.
Looks to be a casualty of the push to make research monetize it’s IP.
“As to whether or not you need such models to help inform policy decisions, well, clearly not for covid-19. The Chinese didn’t need no stinkin’ models, they just welded people in Wuhan into their apartment complexes and gave them food from time to time. That worked.”
yup. no talk of models in Korea, Taiwan, Singapore, HK. act fast when faced with an exponential
Simple model
1. Detect new Virus
2. is it respiratory
3. Any evidence of human to human transmission
4. Does it kill
Take containment actions.
““Modelling of Human Behaviour and Response to the Spread of Infectious Diseases”
Thanks.
SM
“Looks to be a casualty of the push to make research monetize it’s IP.”
Or … or … they needed a commercial company to take it over to add comments, change to longer variable names, consistently use tabs or spaces throughout the source, and otherwise meet the high standards of non-academic software!
(your reason is probably the correct one.)
nice dh
The other day when I was looking at 10 meter data on world wide buildings
I was wondering.
How hard would it be to go full sim city and populate the model with 7 billion agents
Then I thought, damn we need something like tracer particles.. its too much to track everyone
but you could instrument a few people to keep things close to the truth
haha
they could wear these
https://www.upi.com/Top_News/World-News/2020/05/28/Korea-startup-develops-COVID-19-early-detection-patch/1701590677465/?st_rec=4031590994923
at one point I was pitching using thermometer guns outfitted with face recognition but
these patches would be very cool.
if you just ignore the privacy issues it would be a cool system
SM it is interesting that defence is one area of public spending that has been well funded. Another problem is that researchers don’t always know a-priori that their research will end up being policy relevant, and for some it is very unlikely to ever be policy relevant. Hindsight is always 20-20.
That’s why criticisms of Neil Ferguson and his source code base are moot. The decision on what to do based on a virus with unknown behavior has to err on the safe side. Right? Sweden still has the highest per capita problems. Whether to have 5X the number of deaths than your neighbor Scandihoovians is something the Swedes will have to reconcile on their own.
https://www.bloomberg.com/news/articles/2020-06-03/man-behind-sweden-s-virus-strategy-says-he-got-some-things-wrong
It’s looking like peer review processes for the Lancet and NEJM haven’t been up to the task of responding adequately in compressed timelines.
https://www.theguardian.com/world/2020/jun/03/covid-19-surgisphere-who-world-health-organization-hydroxychloroquine
Not pretty.
À propos of nothing:
https://socialsciencespace.com/2015/05/the-never-ending-audit/
Weird how the human mind works.
James,
They’ve now made parameter files available that should reproduce their March report results.
Very Tall Guy:
“It’s looking like peer review processes for the Lancet and NEJM haven’t been up to the task of responding adequately in compressed timelines.”
Andrew Gelman’s had several posts about the surgisphere paper you might find interesting.
First post here:
https://statmodeling.stat.columbia.edu/2020/05/24/doubts-about-that-article-claiming-that-hydroxychloroquine-chloroquine-is-killing-people/
@ATTP,
I am trying to run them right now . However you need a parallel supercomputer to do all of them !
Clive,
Yes, probably. I have switched the number of runs per case (NR) to 1 to test it. If you do that, it may be possible to run them all in a reasonable time on a non-parallel computer.
Thanks Dhogaza. It seems pretty much anyone who’s looked at that has come away suspicious of the results.
“parallel supercomputer”
Are there really any so-called non-parallel supercomputers?
Sweden to ramp up coronavirus testing (2020-05-16 or ~2.5 weeks ago)
https://medicalxpress.com/news/2020-05-sweden-ramp-coronavirus.html
Swedish coronavirus testing hits record but still far below target (2020-06-02 or yesterday)
https://www.reuters.com/article/us-health-coronavirus-sweden-tests/swedish-coronavirus-testing-hits-record-but-still-far-below-target-idUSKBN239217
If no test-trace-isolate strategy is employed does following the US strategy of sheer numbers of tests really matter? IMHO, I don’t think so.
I’ve decided to run 2 extreme of the scale runs first with NR=10
Each one takes about 4 hours on my iMac ! The first failed because I had the output file open in Excel !
7-day rolling means in above graphs unless labeled ‘Daily’.
CB said:
Curious as to how long a complete compilation build takes (from clean source)?
Thanks for the link dhogaza.
I’m reminded of the time the UK’s top heart hospital was splashed in the press as failing because their death rate was well above average. Duh! It’s where the regular heart hospitals send the most severely ill patients when they find they can’t cope themselves. It dealt with a lot of Hail Mary passes.
I believe it may be relevant to this debate to point out what the BCS (the chartered institute responsible for ensuring standards of professionalism in IT) has said in a press release:
“The politicisation of the role of computer coding in epidemiology has made it obvious that our understanding and use of science relies as much on the underlying code as on the underlying research.
“We welcome the government’s commitment to following science in developing policy responses to the coronavirus pandemic. We support the use of computational modelling in exploring possible outcomes of policy decisions, such as investigating which lockdown measures are likely to have the greatest public health benefits.
“At the same time we consider that – at present – the quality of the software implementations of scientific models appear to rely too much on the individual coding practices of the scientists (who are not computer scientists) who develop them, rather than professional software development practices being publicly evidenced against appropriate standards.
“We believe professional software development standards should be followed when implementing computational models for conducting scientific research where that research could be relied on by policy makers and which could have critical consequences for society, such as for example healthcare, criminal justice or climate change.”
Also, I think it may be of interest to some of you on this thread to hear that the BCS seems to have singled out machine learning specialists amongst those who are the worst offenders.
https://www.bcs.org/more/about-us/press-office/press-releases/computer-coding-in-scientific-research-must-be-professionalised-to-restore-trust-bcs/
Dave_Geologist indeed, ISTR David Spiegelhalter gives a good discussion of it in his new(ish) book (“The Art of Statistics” – or something like that, which is well worth a read)
John Ridgway wrote “Also, I think it may be of interest to some of you on this thread to hear that the BCS seems to have singled out machine learning specialists amongst those who are the worst offenders.”
However if you follow the links, AFAICS the Nature editorial is not anying anything about coding, it is talking about the problems with the understanding of the statistical concepts and of the practical considerations.
I’d agree with that – see my comments upthread about the use of software frameworks in ML rather than “coding your own” (which often helps with the deep understanding of how the models work and avoiding pitfalls).
On the topic of “Splitting data inappropriately.”, my imaginary alter-ego (and Mrs Marsupial) has had things to say about themore subtle aspects of that. ;o)
Dikranmarsupial,
Who said anything about coding? The BCS is referring to software development standards, not coding standards. As such, they are as much interested in the adequacy of algorithm validation, and that is the pretext upon which the Nature editorial is invoked.
John –
> Who said anything about coding?
FWIW, before further clarificatjon I thought that your comment was targeted towards coding.
So you might consider that sometimes there can be enough ambiguity in what you say in a blog comment that it could be honestly misinterpreted.
So I’d suggest that you might respond to DK with something along the oder of: “yah, I guess what I said might have easily been misunderstood – thanks for offering the clarification.”
Joshua,
I didn’t say anything. I simply quoted the BCS, so I don’t have to admit to any ambiguity. If you think that the BCS press release was misleading, then fair enough. But, for what it’s worth, I didn’t find it so. Nevertheless, for the avoidance of any further confusion, let it be understood that the question of professional software development standards (as called for by the BCS) includes, but is by no means restricted to, coding standards.
John Ridgway the BCS did – it is in the title of the press release you linked to.
You wrote “Also, I think it may be of interest to some of you on this thread to hear that the BCS seems to have singled out machine learning specialists amongst those who are the worst offenders.”
I was pointing out that the BCS’s evidence doesn’t line up with their accusation.
“The BCS is referring to software development standards, not coding standards. ”
LOL, hair thin distinction being made there (and one that ignores the title of their press release).
It is a shame on-line discussions always end up with this sort of evasion, and in this case it isn’t even as if anyone was accusing you of anything.
“Who said anything about coding? The BCS is referring to software development standards, not coding standards. ”
BTW is that a shift from “coding” to “coding standards”. Did the BCS mention that somewhere? Not as far as I can see, and neither did I.
John Ridgeway
BCS. That’s fairly humorous. While some IT departments may place value in such certification programs, if you start scanning job openings in the most prominent software companies in the world, you’d have to dig hard to see the holding of various certificates issued by organizations such as the BCS listed as a job qualification.
“We’re looking for an experienced web app implementor”. “I have a BCS certificate in agile programming!” Laughter.
There is a reason for this, and it is not ignorance.
I suppose we should stop using linux, or postgresql, or gcc, or any other of the endless list of high-quality open source software projects that don’t follow arbitrary standards set down by the BCS or similar organizations. I’m guessing the BCS probably wrings their hands over this plague of software developed by uncertified practitioners not following BCS software development standards. And that the world of professional practitioners will, for the most part, continue to ignore them.
It has already been explained over and over again why the requirements for software developed by researchers are different than the requirements of commercial software (or large-scale open source projects, though nowadays there is considerable overlap with many open source projects being largely or at least partly supported by commercial entities).
But even the requirements were the same, BCS and similar organizations would have a role that would be miniscule…
The irony is just killing me …
Computer C-O-D-I-N-G in scientific research must be professionalised to restore trust – BCS
https://www.bcs.org/more/about-us/press-office/press-releases/computer-coding-in-scientific-research-must-be-professionalised-to-restore-trust-bcs/
“The computer C-O-D-E behind the scientific modelling of epidemics like COVID-19 should meet independent professional standards to ensure public trust, according to BCS, The Chartered Institute for IT.”
AFAIK C-O-D-I-N-G equals software development.
The C-O-D-I-N-G police bureaucracy would stop all software development in its tracks, so I would suggest them going after Microsoft first. Then Facebook. Then Google. Then Twitter. Then … ad infinitum ad nauseam.
NOAA, Karl, et. al.m 2015, so-called whistle blower outed their coding requirements in said paper were not up to internal bureaucratic standards or some such.
And nothing substantive ever really happened after that exposé happened AFAIK.
Those comments by Ferguson to the HOL select committee were shocking. I realise that accusations of lying are not to be made lightly in such circumstances…but seriously, pretending that the problem with their predictions was to do with imported cases from Spain and not that they hadn’t bothered to calibrate their model? What planet is he on?
This story isn’t going to go away in a hurry.
JA,
Link?
Are you referring to something really recent like this …
COVID-19: the role of modelling in UK response
https://www.parliament.uk/business/committees/committees-a-z/lords-select/science-and-technology-committee/news-parliament-2019/covid-19-epidemiological-models/
Video or transcript link(s) most welcome.
TIA
Given that the controversy is focused upon code used in a model, it is unsurprising that the BCS article makes several references to ‘code’ and ‘coding’, but that is not the issue. When it came to the recommendation made, the term used was ‘professional software development standards’. It was important, therefore, for me to point out that they were not just calling for ‘professional coding standards’, nor indeed just ‘professional coding practices’. Diskran called into the question the relevance of BCS’s reference to an article because he could not see anything in that article that related to coding, whether it be standards or practices. The point is, however, that the article concerned referred to a validation practice, and validation is just one of the many processes that is covered by the term ‘software development’, but not ‘coding’. The fact is that systems that employ machine learning provide a number of challenges to those that require such systems to be certificated for use, as in safety-critical systems. The traditional approaches to validation are difficult if not impossible to apply and it is an area crying out for new open standards to be developed. And it is not just the BCS saying this. Please also keep in mind that the BCS were not calling for all code developed in a scientific context to meet commercial standards, they were calling for improved development standards when such code is used to inform policy that is critical to public welfare.
There is a serious debate to be had here but not if people are just going to insist that software development is only about coding, and certainly not if people are just going to haughtily deny the relevance of the opinions of a chartered body tasked with promoting standards of professionalism.
My apologies, I should have said ‘Dikran’.
John,
How do you imagine the whole “coding standards” suggestion would work in practice in academia? We’re certainly encouraging better coding, and the use of respositories, but other than encouraging better practice, what else do you think could/should be done?
“The point is, however, that the article concerned referred to a validation practice, and validation is just one of the many processes that is covered by the term ‘software development’, but not ‘coding’.”
John, it isn’t the software that is the subject of the validation in the Nature article, but the statistics/science on which the model is based. It has precisely nothing to do with “coding standards”. It is my research topic, as I have pointed out, I have published papers on this stuff, as I pointed out.
” The fact is that systems that employ machine learning provide a number of challenges to those that require such systems to be certificated for use, as in safety-critical systems. ”
Yes, this is well known in the ML community, but it still has precisely nothing to do with coding or software development standards.
“There is a serious debate to be had here but not if people are just going to insist that software development is only about coding, ”
can you remind me again of the title of the BCS article?
The ML issues are to do with statistical practice, not software. You would run into the same issues if you sat down (for a very long time) and worked the models by hand with pen and paper.
Now there are interesting things to talk about WRT software and science, but this isn’t one of them and I have explained why, so why not just stick to the general topic rather than to keep doggedly defending this one bad example.
Calibration, validation and verification have always been a part of any model development. Numerical, physical or in the field. The perfect is the enemy of the good.
BTW both the Nature and BBC articles mentioned raise the issue of patterns that are detected where no pattern really exists. We don’t need a computer model for that, our own neural networks are brilliant at it, as demonstrated by the public (and scientific) discussion of “the hiatus”*. Is it still a “software development standards” issue when a computer isn’t involved but the very same problem is encountered?
… actually the thing science needs most is “wetware development standards” ;o)
* ironically, in that case a fair few scientists (both skeptic and mainstream) were refusing to discuss what statistics had to say about that particular pattern as well.
Everett,
Blogged briefly…
http://julesandjames.blogspot.com/2020/06/doubling-times-and-curious-case-of-dog.html
> The traditional approaches to validation are difficult if not impossible to apply and it is an area crying out for new open standards to be developed.
So all we need is to apply standards to be developed.
Should be done next week.
What is the ML community?
James,
I’ve been running the Imperial College code with the parameters they used for the Report 9 paper. It does seem pretty clear that the 20000 deaths estimate is based on using an R0 value that, in retrospect (you might say, obviously 🙂 ) was too low.
Govts either want scientific advice or they don’t. Of course it’s important to make sure that the science is as robust as possible – it’s possible that my role in establishing https://www.geoscientific-model-development.net/ will prove to be more significant than anything I achieve in a more conventionally scientific sense – but certification and charters aren’t the way to go.
@ATTP
Have you managed to run it 500 times yet ?
Report 9 assumed R0=2.4 The released model uses R0=3.0
Clive,
The report 9 parameters used R0=2.4, but you’re right that the earlier release used R0=3. Even then, I think I found R0=3.5 fitted the data better. I’ve run it a fair number of times. Not sure if it’s quite 500 yet.
John Ridgeway
“certainly not if people are just going to haughtily deny the relevance of the opinions of a chartered body tasked with promoting standards of professionalism.”
The key word here is OPINION. BCS has a self-interest in promoting the notion that following their standards and getting their certifications are a necessary component of professionalism.
Not a shred of empirical evidence that following their standards or employing people they’ve certified actually increases the quality of software products.
@ATTP
I’ve had a bit of a nightmare today but have finally figured out how to run “batch.sh” on my iMac over several hours. You have to first manually create the directory “meanT8_NR10”. The readme file is fairly obtuse. 😉
Clive,
Yes, I also spent a bit of time working that out. I also had to delete a bunch of lines in the batch script and hardwire in the steps in the loops.
Clive and ATTP
Having managed an open source project many years ago which had about 100 contributors (not all developers), I have to say that one of the easiest and most appreciated ways to contribute is to improve documentation.
Just a hint, if either of you is so inclined 🙂
“SM it is interesting that defence is one area of public spending that has been well funded. Another problem is that researchers don’t always know a-priori that their research will end up being policy relevant, and for some it is very unlikely to ever be policy relevant. Hindsight is always 20-20.”
yes. I will say that I found it funny how history repeated itself. When hansen first let out his temperature code, skeptics had the same kind of responses.
basically valid criticisms that DONT MAKE A DIFFERENCE
“Who said anything about coding? The BCS is referring to software development standards, not coding standards. As such, they are as much interested in the adequacy of algorithm validation, and that is the pretext upon which the Nature editorial is invoked”
Huh I read the BCS “report”
.https://cdn.bcs.org/bcs-org-media/5780/professionalising-software-development.pdf
it is a JOKE. and not even a funny one.
> certification and charters aren’t the way to go.
Since I still can’t believe the guy probly had no idea about CA or NA, with emphasis:
https://socialsciencespace.com/2015/05/the-never-ending-audit/
More standards mean more money.
Making people read Michael Ende would solve so many things.
cited as “evidence” in the report
https://www.nature.com/articles/d41586-019-02307-y
Splitting data inappropriately.
Nothing to do with software development process or coding
Hidden variables.
Nothing to do with software development or code
Mistaking the objective.
nothing to do with software dev or code.
In short. The “report” makes a call for “professional standards” in code development
( Hint these standards of course change over time, anyone remember waterfall?)
and they cite as evidence for the need a nature paper THAT SAYS NOTHING about
the software development process or code.
The paper in question discusses other issues, unrelated to the actual dev process.
> What is the ML community?
ML stands for Machine Learning:
“https://socialsciencespace.com/2015/05/the-never-ending-audit/
Weird how the human mind works.
yes we need to audit the people calling for professional standards and make sure they followed professional standards in calling for professional standards.
standards for thee not me.
Re ML. Having just come out of a startup aiming to use ML to drive autonomous vehicles… The problem is not “code” or “coding standards” or anything like that. The problem is training the network and trying to understand where/when the resulting network will function well. There are plenty of stories of ML networks trained to recognize pedestrians that end up:
* classify women in shorts as a pedestrian, but not women in skirts
* do not recognize Chik-FilA guy in a chicken suit as a pedestrian
* do not recognize black people as pedestrians
etc. Everything depends on the data set you used to train the system.
There are tons of smart people in the industry and academia trying to figure out how to make this work. Currently most effort seems to be focused on validation (tests against standardized real-world situations and simulation) and almost none of it is focused on coding standards. Though that is because it is assumed you are following some sort of standardized development process. The point being that “good code” is not sufficient to end up with a good ML product.
Yes. By all means we need a standard:
https://xkcd.com/927/
SM
“it is a JOKE. and not even a funny one.”
You bothered to read it? 🙂
I guess someone needed to take one for the team. No, not THAT team.
Yeti wrote ” The point being that “good code” is not sufficient to end up with a good ML product.”
Very true. Ironically there is now lots of good code available, vastly more than there was when I started in 1990, but part of the problem is that it makes it very easy for people to do very complicated things without going through the experiences that help you to learn the skills that are required to engineer an ML product without falling into the kinds of pitfalls mentioned. Oddly enough I’ve learned a fair bit since 1990, but it was 20 years of experience (i.e. getting things wrong) that went into the paper I mentioned earlier. There are coding short cuts, but there are no short cuts on the statistical practice (yet).
Willlard: re. the Huseini Yusif tweet – ouch! ;o)
SM: “Hint these standards of course change over time, anyone remember waterfall?”
The iterative waterfall model is still a good starting point for students learning to program (with an eye to software engineering) where the project is fairly small scale (not necessarily from their point of view ;o), the student isn’t working as part of a team and there is no real “client”. It gets the message across that you need to work on understanding/refining the specifications before you start and to think about resources and design before opening the IDE and coding, that you need to do testing and that you ought to program in a way that minimises the costs of maintenance (which is comparatively boring, so minimising the pain is a good thing ;o).
In a lot of science (especially climate codes, and particularly Met Office ones) ‘professional’ computer scientists are directly involved. Also, there are funded mechanisms in science promoting improved software development, like the ‘Software Sustainability Institute’, and all the ‘Research Software Engineers’ in unis.
Makes no difference to politically motivated attacks, obviously, but I think some of this is actually quite useful.
The tough part in terms of code correctness is pretty much always determining the regime in which the results are trustworthy. Making sure that the simplifications/approximations used to turn the physical problem into a mathematical model and discretise it are valid. Often the tricky part is that the physical observations to compare against are quite noisy and incomplete (e.g. it is hard to get in-situ measurements of the internal motion of the Sun).
Bob Loblaw – As Andrew Tanenbaum said “The nice thing about standards is that you have so many to choose from.” ;o)
ATTP,
In general terms, the approach required may involve the introduction of a safety life cycle, akin to that advocated by standards such as IEC 61508. Focusing in on coding standards, one may have to consider those that impose the use of safe subsets, such as the standards developed by MISRA. Whatever the case, the changes will involve a great deal more cost and delays in development, neither of which will sit easily with the broader objectives of academic research.
Dikran,
I wouldn’t deign to question your expert authority regarding ML. However, your assertion that the validation problems encountered have nothing to do with software development (or coding, as you insist on calling it) are not plausible. Otherwise, why would there be so much attention being paid towards adopting and adapting development lifecycles such as those advocated by ISO 26262? Take, for example, the following paper produced by the University of Waterloo, the abstract for which says:
“Machine learning (ML) plays an ever-increasing role in advanced automotive functionality for driver assistance and autonomous operation; however, its adequacy from the perspective of safety certification remains controversial. In this paper, we analyze the impacts that the use of ML as an implementation approach has on the ISO 26262 safety lifecycle and ask what could be done to address them. We then provide a set of recommendations on how to adapt the standard to accommodate ML.”
.https://arxiv.org/pdf/1709.02435.pdf
So yes, there is a problem when using ML in certain application areas, and yes, enhancement of software development standards is seen as a solution. I should also point out that it isn’t just the BCS and the likes of the University of Waterloo who are interested in such issues. I could also point to another body set up to promote improvement in development standards and best practice for safety-related applications, namely the SCSC. It is very interested in the software development challenges that developments in ML have posed and has dedicated its latest quarterly publication to them.
As I have already said, coding practices and standards may be an issue, but as far as safety-related applications are concerned, the broader software development lifecycle is of much more interest.
Everyone else,
No one likes the imposition of standards, but seeking to denigrate those organisations that promote their development and application is never a constructive strategy in the long term.
John,
That doesn’t explain how you do it in practice. For example, an academic without funding may not have the resources to follow those practices. Are you saying that they can’t then publish any papers, or that – if they did – those papers would have no value? Government wants an answer to some question and the only code available is one written 10 years ago that didn’t follow these practices. Should they do nothing, or should they use that code despite some possible shortcomings? etc.
ATTP,
They have to use what they have got and ensure that everyone understands the nature of the compromise. However, it is clear from this thread that the nature of the compromise is disputed. For what it is worth, I don’t think it is just a matter of coding practice. As for your point regarding funding, I sympathise entirely.
“I wouldn’t deign to question your expert authority regarding ML. However, your assertion that the validation problems encountered have nothing to do with software development (or coding, as you insist on calling it) are not plausible.”
LOL. The juxtaposition of those two sentences is rather ironic.
BTW I teach programming at undergraduate level. I know the difference between software development and so do the BCS, and coding was their term for it.
“Otherwise, why would there be so much attention being paid towards adopting and adapting development lifecycles such as those advocated by ISO 26262?”
So much attention? Google scholar suggests otherwise, the most highly cited paper I could find was that one, with 42 citations, and a paucity of journal papers. That suggests there is a small commuity of researchers working on that topic. I’ve been going to machine learning conferences for decades, and there is rarely more than a special session about that sort of thin, if that. Give me a break!
Don’t get me wrong, I’m not against any of this kind of work, it is just that if something is presented as evidence to support an assertion, and it doesn’t actually support it, then I find it unconvincing. I find it even less convincing if someone continues to make the argument on that basis, rather than admitting that particular piece of evidence was weak (at best) and making a better argument that I could agree less equivocally.
“I’ve been going to machine learning conferences for decades, and there is rarely more than a special session about that sort of thin, if that.”
Why am I not surprised?
You should be surprised as it suggests your assertion was incorrect.
As I said, I am not at all hostile to this sort of research, indeed I make a point of explaining some of the problems in safety critcial applications in my undergraduate lectures on ML (for reference, I also teach operating systems). However, it isn’t true that it is getting a lot of attention, AFAICS, and the evidence you provided suggests that (c.f. number of citations). It isn’t getting that much attention (perhaps not as much as it arguably should), I suspect mostly for the reasons I gave upthread (there are other issues that take priority).
Another reason why standards are bureaucratic squirrels here is that coding, like language, is a social art. There are tons of research on cognitive models that show how humans differ in solving abstract problems. Adding formal norms won’t make that plurality disappear. Otters’ code might always be needles in the eyes, to borrow from the Auditor’s parlance.
There’s really no reason to appeal to a wishy-washy three-pagers to understand that the epidemiological deliverables we got right now ain’t good enough. More so when these concerns are raised by freedom fighters who usually whine about the having too much rulz around them.
Speaking of models, the Imperial Collage code performs a lot better than the US government’s economic models considering the reality of a global pandemic,has been forecasts for decades (and has human climate change fingerprints all over it).
Anyone want to take a stab at how economic missed a 2+ million jobs gain when nearly all the financial market models were forecasting a 7.5 million drop? Must be a great job writing the models that run the simulations that the Bureau of Labor Statistics uses to publish it’s reports.
It’s turtles all the way down.
” Otters’ code might always be needles in the eyes, to borrow from the Auditor’s parlance.”
Indeed it often is, but part of being a good programmer (rather than merely a coder) is learning to anticipate the needs of other human beings, particularly the poor souls who get the job of maintaining the code we write. Less applicable in scientific circles as generally we maintain our own code (very rarely will someone volunteer to do it for us). Writing code that the computer understands is fairly easy (the compiler is the standard), writing code that can be maintained by human beings is much more difficult. It does mean we don’t get all our own way, and nobody likes that!
… and for that there are no standards, and I don’t think they are necessarily useful, but fortunately we can use our common sense if we choose to make the effort.
John Ridgway:
I’ve worked with ISO26262 (functional safety for automotive) and DO-178 (SW certification for commercial aviation.) These standards are aimed at managing risk in specific industries. There is no such thing as perfect SW, and no such thing as perfect safety. The standards, when followed strictly, increase cost and time to your project by 2x – 5x depending on which level you follow. No one does this unless there is a very good reason to do it. Academics don’t do this, these standards are not created for academics.
Automotive follows these standards because they have very large fleet sizes. So any error will get multiplied by many cars and result is large liability for the manufacturer. It’s economics.
Aviation follows these standards because they are required by regulation. Any airliner crashing means a large number of people dead, lots of money, and lots of senators grilling you.
The standards are important because there is no competitive testing, no peer review, just what happens in the real world.
Academia is different. There is peer review, there is independent checking (as has been noted in this thread, it is common for people to write their own code to check results), and even when output is used to inform policy, it just being used to inform. As we know from the Climate Wars politicians will do whatever they damn well please. If an academic paper supports what they want to do, well good, quote it; if a paper doesn’t support what they want to do, attack the “coding”.
If you want solid science with industrial style SW practices then please write to your government to increase scientific funding by 2x – 5x.
By the way, the only reason people are discussing ML and ISO26262 in the same sentence is because of autonomous vehicles. ML is *the* method for turning computer vision into an actionable description of the world around the vehicle. Neither ML or ISO26262 have anything to do with the Imperial College code.
Meet JohnR, Yeti:
https://cliscep.com/author/johnridgway4
He’s supposed to be big in risk management, but don’t sweat it.
***
Wait:
Why haven’t you told me, JohnR?
“Re ML. Having just come out of a startup aiming to use ML to drive autonomous vehicles… The problem is not “code” or “coding standards” or anything like that. The problem is training the network and trying to understand where/when the resulting network will function well. There are plenty of stories of ML networks trained to recognize pedestrians that end up:”
yup. it took a week for the image recognition software at our company to recognize a white face.
we had a few laughs over that
“Not a shred of empirical evidence that following their standards or employing people they’ve certified actually increases the quality of software products.”
yes that is what I was expecting in their “Report” Instead I found nothing.
They need report writing standards
“The C-O-D-I-N-G police bureaucracy would stop all software development in its tracks, so I would suggest them going after Microsoft first. Then Facebook. Then Google. Then Twitter. Then … ad infinitum ad nauseam.”
John is redefining what they meant because they did not follow professional standards for CLEAR WRITING
John
interesting paper
Click to access 1709.02435.pdf
“s. In all, we identify
five distinct problems that the use of ML creates and make
recommendations on steps toward addressing these problems
both through changes to the standard and through additional
research.”
instead of forcing a standard on ML, they propose changing the standard.
‘In this section, we detail our analysis of ML impacts on
ISO 26262. Since an ML component is a specialized type
of software component, we define an area of the standard
as impacted when it is relevant to software components and
the treatment of an ML component should differ from the
existing treatment of software components by the standard.”
it seems what people like BCs should be doing is seeing how their standards should be
changed to adapt to existing practice.
basically, this is the kind of thing that happened with Ada and Milstnd 2167A/T
“So all we need is to apply standards to be developed.
Should be done next week.”
John is not arguing that standards should be applied. The paper he cited argues the reverse.
Standards should be changed.
maybe he didn’t read it.
we should apply comprehension standards
reading comprehension standards.
“Required software techniques. ISO 26262 mandates the
use of many specific techniques for various stages of the
software development lifecycle. Our analysis shows that while
some of these remain applicable to ML components and others
could readily be adapted, many remain that are specifically
biased toward the assumption that code is implemented using
an imperative programming language. In order to remove this
bias, we recommend that the requirements be expressed in
terms of the intent and maturity of the techniques rather than
their specific details.”
Bottom line. John’s cited paper details ways in which
STANDARDS FAIL and should be changed.
So of course folks will change the standard to fit the practice.
So the right perspective on this is that standards guys should be adjusting their standards to covering the existing academic practice.
“Having managed an open source project many years ago which had about 100 contributors (not all developers), I have to say that one of the easiest and most appreciated ways to contribute is to improve documentation.”
yup
“Having managed an open source project many years ago which had about 100 contributors (not all developers), I have to say that one of the easiest and most appreciated ways to contribute is to improve documentation.”
they should skip straight to formal verification and formal proofs of code correctness
in the crypto world its a big thing
Alternatively:
https://www.researchgate.net/publication/2763558_Modal_Logic_as_a_Software_Engineering_Tool
I’m sure DavidB has a few things to add on this.
SM
“they should skip straight to formal verification and formal proofs of code correctness”
I dove into that fairly deeply when it first became a thing. Knew a couple of the academics in Europe who were pioneering the concept. That was a long time ago.
Of course, with some languages like Pascal (and later Ada) it’s also possible to derive some (usually weak) properties of the code being processed by a compiler and then use that information to optimize code generation while still maintaining the safety net of runtime checking. I spent some time with that, too.
Now proving the correctness of encryption code is useful, though the implementation is always going to be at least as weak as the correctness of the mathematics defining the encryption algorithm. It was what, two years ago? A bit more? that a paper and proposed proof came out showing the SHA256’s effective keyspace could be expressed in 254 bits. Knocking down the brute-force search space by a factor of four. In some contexts a big deal, but in the context of 256 bits … not so much.
Very early on in this thread I pointed out that the most meaningful documentation for the IC model (this is the IC model thread, I believe?) was really the original paper from 13 years ago describing the 13 year old model the current, slightly massaged model is based on.
And this is true. However, ATTP and Clive were talking about the opaqueness of the parameterization file … which isn’t really the “model” part of the model …
“I could also point to another body set up to promote improvement in development standards and best practice for safety-related applications, namely the Ministry of Information and Central Services.”
““I could also point to another body set up to promote improvement in development standards and best practice for safety-related applications, namely the Ministry of Information and Central Services.”
i was hoping someone posted that for tutle
dhogaza,
on crypto I got cornered at a party by a cardona guy who was carrying the gospel of haskell.
it got me curious but there is only so much time.
“Very early on in this thread I pointed out that the most meaningful documentation for the IC model (this is the IC model thread, I believe?) was really the original paper from 13 years ago describing the 13 year old model the current, slightly massaged model is based on.
And this is true. However, ATTP and Clive were talking about the opaqueness of the parameterization file … which isn’t really the “model” part of the model …
I think we all have some sympathy for the need for standards of sorts when it comes to
policy relevant code— lets expand that to “Systems” to capture all the aspects of model creation, that might better capture all the issues: data, config files, code, tests, verification, validation, reports, documentation… blah blah blah.
obviously no one is arguing for total chaos in the development of systems, and also no one ( except maybe John) thinks that standards/processes create greatness ex nihilo.
Yeah, my feelings are along the lines SM is suggesting.
Seems like some standardisation (or something less formal, like a code of practice) of the most obvious policy-relevant codes+associated material would be helpful, without being excessively onerous. Not nonsense like ISO standards for life-critical medical equipment that needs 5x the work, but a month or two of extra effort from a specialist in packaging, documenting and ‘cleaning’ scientific software. Then it can get a tick from the royal worshipful company of statistical modellers or whatever.
I haven’t looked, but if there were small example cases with example output described that you could run on a laptop to get familiar with how the code works, that would prevent a lot of the messing around and confusion that we saw with the IC code. Plenty of neat science codes do this already.
In general the idea that a scientific code is not a valuable output of the science process needs to change a bit. Not all of it is thrown away at the end of a phd; some are durable pieces of research infrastructure.
Ben McMillan wrote “Not all of it is thrown away at the end of a phd; some are durable pieces of research infrastructure.”
Indeed,but the problem remains is that we don’t always know which it will be when we write it or whether it will become policy relevant later on (e.g. dendrochrolology/surface temperature datasets back in the 1980s, IC model when first developed?).
I agree formal standards is the wrong way to go about it – it is likely to reduce the amount of code made available. One thing that would help would be for software to be recognised as a formal research output (like papers) and rewarded (e.g. category in REF submissions). It would then be easier for academics to justify spending time on writing high quality research software.
Getting codes as a REF output is definitely something I’ve heard people pushing for: at least they can sort of go into the impact cases at the moment.
How you pick which codes have to be “up to spec” is a tricky one.
Ben,
AFAIA, software is an allowed REF output. I think most, though, are nervous about submitting something like that because they don’t know how it will be assessed if it’s a unit of assessment that typically submits papers as outputs.
ATTP: well, you made me read the document defining outputs, and you are correct. And probably also about why hardly anybody does this in practice.
ATTP indeed, perhaps it would be better to broaden the definition of “impact” to include impact on the research community, which good software definitely does. Over the last decade or so, universities ave been coming under greater and greater pressure to be like industries, so most of the focus is bound to end up on the finances. If you tell your head of department that you would rather spend your time improving the quality of your software, rather than writing grant proposals, I suspect you might not get an overly enthusiastic reception (unless improving the software may result in grants – occasionally there are themed software grant programs).
I’m quite curious now to find out the proportion of “outputs” from the last REF from Computer Science departments were software rather than papers…
Dikran,
The issue is that impact has to be impact beyond academic research impact – it has to be how your research had a broader impact. Probably better to encourage submission of software as an output. However, until we have some way of assessing that, it will probably still be tricky.
Yes, that is largely my problem with “impact”, there are many subjects where excellent research will never have any direct impact beyond it’s own research community, and I don’t think REF should be putting pressures (or encouraging) one research field over another (directed research council programmes would be a better way). Perhaps an “academic impact” category? The difficult with making it simply an output is that it will be difficult to judge its quality relative to papers, but its impact on the research community is more easily estimated (impact and quality are not necessarily correlated). Software may be more likely to be submitted then?
Getting a specification for published datasets would already be great.
But if we’re serious about publishing code, we need to be able to cite it, e.g.
https://citation-file-format.github.io/
Only time tells if a convention takes off.
Like language, it’s a social art.
Dikran,
Yes, maybe a way of getting assessed on academic impact does make sense. I’ve always been – like you – a bit anti the impact agenda. I will say, though, that being more involved in preparing for REF has made me more aware that there is a lot of broader impact happening. I prefer this to be a natural part of the academic process, rather than something we feel pressurised to do, but I am quite amazed by how much is actually happening.
Yes, I am certainly not against work with societal impact, I’ve worked on that sort of research in the past (and would be keen to do so again in the future if I ever get my marking finished ;o). I gather part of the reason for its inclusion in REF is to demonstrate value for public funds, but there is a lot of work (for instance statistical methodology) which has a big impact on society, but it is indirect and hence not included in REF impact. Not sure e.g. cosmology will ever have a big impact on society (except being interesting if covered at a very superficial level), but I think it is very important that people work on it.
Basically, as I said earlier, if society wants good quality research software, then they have to pay for it (or at least not discourage it by rewarding other things too much).
“Seems like some standardisation (or something less formal, like a code of practice) of the most obvious policy-relevant codes+associated material would be helpful, without being excessively onerous. Not nonsense like ISO standards for life-critical medical equipment that needs 5x the work, but a month or two of extra effort from a specialist in packaging, documenting and ‘cleaning’ scientific software. Then it can get a tick from the royal worshipful company of statistical modellers or whatever.”
As others have mentioned a good place to start is
1. Allow researchers to publish data as an actual citable resource with a DOI ( thats happening)
AND get credit for doing so,
2. Same for code and as willard notes it should be CITABLE.
3. Credit for cross training. heck when i was in industry you push people to get training in related fields. A class here, a class there. its good for professional development and creativity.
As an academic I spent a lot of time auditing classes outside my field ( literature) and
took stats and programming. Took all the tests blah blah blah, Uni didn’t charge, professors
didn’t care, I wasn’t a burden in fact for some classes I would help out slower kids in section.
standards will evolve and be adopted, standards that arise organically from the practice tend to A) be better, B) be more readily accepted. But you need incentives.
Bottom line, if folks want better code (systems) from academics then you better be willing to pay
and make investments and reward people accordingly. It isn’t going to magically happen
by chanting “open code” and “ISO” ( I know I tried)
Ben
“I haven’t looked, but if there were small example cases with example output described that you could run on a laptop to get familiar with how the code works, that would prevent a lot of the messing around and confusion that we saw with the IC code.”
Well, sure, but the IC model was never intended for general use, it was developed for one team’s research. Ferguson made comments to the effect that it sat more or less static for 13 years and was “dusted off” (I think those where his words, something to the effect) when covid-19 broke out.
My understanding is that when the UK government came knocking at the door, it wasn’t to ask for a copy of the model so that they could run it themselves. It was to ask for what help Ferguson et al could give them to help them make policy decisions. So it didn’t really matter that folks like ATTP and Clive might have problem understanding how the parameters work. Presumably Ferguson et al did.
Though 13 years after development there’s a good chance that Ferguson wished he’d done a better job documenting the parameter semantics, right? 🙂
As Dikranmarsupial says, “but the problem remains is that we don’t always know which it will be when we write it or whether it will become policy relevant later on (e.g. dendrochrolology/surface temperature datasets back in the 1980s, IC model when first developed?)”
This does seems true of the IC epidemiological model.
Now, if governments wanted robust epidemiological models to deal with such a threat, perhaps government should’ve funded the development of such models beyond simply funding a bit of research that, while it apparently had an impact on the field, was nothing more than just that … research by some academics. Though given Ferguson’s original flu model’s focus on the efficacy of Tamiflu combined with various isolation strategies makes me wonder if a pharma company provided some/much of the funding, not government, so even this might be crediting government too much.
But clearly governments didn’t really treat the possibility of an epidemic such as we’re seeing as a tangible threat, and chose not to spend much money on tools to help counter the threat. And obviously this wasn’t restricted simply to epidemiological models.
So it seems that picking on academic researchers and the software they produce is picking on the wrong target in the first place. Most of the software produced in academia (even in CS departments, I’d suggest) don’t see much of the light of day and it’s probably fine that this is true. It’s probably even best that this is true 🙂
Meanwhile the discussion about how to get software recognized as valid research output, etc, is good.
From a Darwinian perspective, you need to ask what the reward system selects for. When only certain parts of the job lead to tenure, promotion, research grants, etc., then the system will end up being populated by two kinds of people:
1) People that only value those few things that are rewarded.
2) People that value other parts of the job, but realize that they have to de-emphasize those activities in order to survive.
The third group of people – the ones that value those non-rewarded activities AND spend time on them – tend to get weeded out. They certainly find it difficult to survive in the system long enough to get the opportunity to change it.
Although teaching was supposed to be a “major” factor in my tenure review (25 years ago), the chairman’s claim that my teaching was acceptable was all the “proof” that the tenure committee needed to be convinced it was indeed acceptable. I perished because I should have spent little or no time on teaching and published more.
I never really understood why academics were so badly rewarded to publish their teaching material. It’s as if universities did not value the deliverables to their main customers. And students are more than customers – they’re the very reason why these institutions exist.
No wonder we’re stuck with a predatory industry.
“I never really understood why academics were so badly rewarded to publish their teaching material.”
There are downsides to that, it is becoming rather difficult to set an interesting and relevant programming assignment these days for which a solution cannot be readily downloaded from the web (especially on topics like operating systems). In some ways this is a very bad time to learn programming (in other ways, of course it is a very good time).
Ideally students are not customers (I was fortunate enough to go to university in the era where students had grants – I was paid to be there, more like an employee than a customer, because I was doing something that would hopefully benefit society).
Teaching is recognised a lot more than it used to be. It is not uncommon to have a lecturing contract with no research element, with its own promotion criteria, which is a good thing IMHO.
Again, what are the rewards? Undergraduate students are a means to get funding, so teaching only needs to be good enough to get them in the door. You don’t actually want to make the material too difficult, or enrollment will drop. A lot of students are taking a few classes in their major that they care about, and a lot of courses they don’t care about “…that I can pass, so my old man will pay my tuition.” (An exact quote from a student during my days as a prof). When numbers of students are the measure, not the quality of the education, guess what ambitious people will do?
To too many profs at major research universities, the only undergrads that matter are the ones that will go on to a Masters. And the only Masters students they care about are the ones that will do PhDs. And the only PhDs they care about are the ones that go on to post-docs and can become profs, because those are the grad students that will help bring in the research grants. Indentured servitude.
When I was an academic, the provincial government was cutting money to universities and colleges. At one faculty meeting, a prof was saying “maybe we need to send out people [he was thinking faculty members] to the community to tell the general public all the important reasons for having a university system”. My thought was “we already have thousands of people doing that. They’re called alumni. When they see that a prof doesn’t care about teaching, what do you think they tell their friends?”
The students were there to benefit the profs. (I thought the profs were supposed to be there to benefit the students. I didn’t get tenure.)
“It is not uncommon to have a lecturing contract with no research element, with its own promotion criteria,
That is a good direction to move, but from what I hear in Canada, more and more of the teaching is being carried by sessional lecturers who are trying to pay the bills while they wait for that elusive tenure-track job. No sense of permanency or promotion. Set rates per course taught, not a salaried position.Get caught on that treadmill for a few years and you’re now too stale to get a tenure-track job.
Some people are pushing for what you describe, but I”m not sure that much progress has been made.
> I thought the profs were supposed to be there to benefit the students.
Well:
Bob Loblaw, in the U.K. they tend to be permanent posts (we don’t really have tenure as such). In some cases they can be faculty who are no longer research active, but some are lecturers who chose to be teaching only from the outset (which is good – some subjects are fast moving and need more time for “scholarship” and we want lecturers who *want* to do it).
I'[m not exactly sure what to say any more, except that it looks rather grim for the Rest of World (RoW). Row stands at ~23-day doubling time with ~115k deaths to date. RoW 20 (e. g. BR, MX, IN, RU, PE, …) stands at ~18-day doubling time with ~79k deaths to date. RoW 20 includes all current countries with a mean of at least 114 days (the mean or 1st moment) for the current day of 137 (2020-06-07).
https://sciencex.com/news/2020-06-superspreaders-transmit-majority-coronaviruscases.html
So this should be in models?
Red herrings about standards for autonomous vehicles aside, I still don’t think it would require very big incentives (or any real extra money) to bring up a decent fraction of science codes to a reasonable standard in terms of packaging/documentation. Might not need more than a bit of nudging, given scientists spend a fair bit of time doing stuff that isn’t explicitly rewarded anyway.
Just requiring that any grant that involves developing a significant piece of software has funding/support towards this end would probably be a good step. This would, at least in the long term, actually save money. Ideally software developed with public money should also be publically available, and this isn’t meaningful unless it is in a fit state.
Ben
“Just requiring that any grant that involves developing a significant piece of software has funding/support towards this end would probably be a good step.”
Great! Now you get to define a “significant piece of software”.
Before the research is done and the software written.
Ferguson’s model wasn’t, 13 years ago. The paper, showing how to go about an agent-based model to ask questions about a particular scenario, apparently had some impact.
But the code itself?
Sat on the shelf for 13 years.
I’m going back to what I said earlier: if government thought that epidemiological modeling was a national priority, then they should’ve funded it properly. They might’ve piggybacked on Ferguson’s work (which they are doing now, with professional software engineers from MicroSoft and github in some level of control – they review and approve or reject (with commentary) Ferguson’s proposed changes). But why would this have been imposed on Ferguson’s original modeling effort?
Ben “I still don’t think it would require very big incentives (or any real extra money) to bring up a decent fraction of science codes to a reasonable standard in terms of packaging/documentation”
I can tell you from personal experience that you are wrong. Generating good documentation for research software takes a long time (which is why it never got finished in the case of my SVM toolbox. My teaching load and pressure to get grants (and write papers) meant I never had the time to do it,
“Just requiring that any grant that involves developing a significant piece of software has funding/support towards this end would probably be a good step.”
That is more than a nudge, it is an increase in the cost of funded research. BTW not all research software is the result of a grant. My SVM toolbox wasn’t and neither was my GKM toolbox.
“This would, at least in the long term, actually save money.”
I don’t think that is true. A lot of research software is never used again after the project finishes. Difficult to know at the time whether this project will be one that generates lasting software or not.
“Ideally software developed with public money should also be publically available, and this isn’t meaningful unless it is in a fit state.”
That is pretty much where we are now, getting it in a fit state to share, rather than fit to be used by the author costs time and energy that will not be recognised, which is why it doesn’t happen more. This is time and energy of people who don’t have much time, even if they do have energy,
Well, if you are writing a grant then you and the people reviewing the grant are the ones defining what a significant piece of software is. This kind of judgment call is everywhere in science so needing to define what significant means is not exactly a showstopper. Obviously there is wiggle room.
Indeed Ferguson’s code sat on a shelf for 13 years: maybe if it was made available in a clean way, it wouldn’t have. Instead, it was suddenly resurrected in the middle of a pandemic: that seems non-optimal to me. No doubt a whole bunch of people wrote their own codes in the meantime.
In many fields, the codes themselves do make an impact, and they get used by a large number of groups.
I don’t think much would have changed in Ferguson’s modelling effort if the code was neater: luckily Ferguson was still around and was able to reincarnate the modelling. I think ATTP and others would have been more efficient reproducing these results, which is obviously only important at second order. The whining about code standards maybe wouldn’t have have been as impactful.
I guess I’m struck that the main response to the idea of improving the software engineering/packaging of science codes is to try to assign blame elsewhere. Dismiss any actual mechanism for actually doing so as impractical or too expensive. Basically, see it as not a problem to solve but a non-issue to be waved away.
@-Ben McM
“Basically, see it as not a problem to solve but a non-issue to be waved away.”
Can you think of an exception to the rule that the only time the code and software engineering used in research is seen as a problem is when that software supports science that is politically, or ideologically inconvenient ?
Critiqued coronavirus simulation gets thumbs up from code-checking efforts
https://www.nature.com/articles/d41586-020-01685-y
Estimating the effects of non-pharmaceutical interventions on COVID-19 in Europe
Abstract
Following the emergence of a novel coronavirus1 (SARS-CoV-2) and its spread outside of China, Europe has experienced large epidemics. In response, many European countries have implemented unprecedented non-pharmaceutical interventions such as closure of schools and national lockdowns. We study the impact of major interventions across 11 European countries for the period from the start of COVID-19 until the 4th of May 2020 when lockdowns started to be lifted. Our model calculates backwards from observed deaths to estimate transmission that occurred several weeks prior, allowing for the time lag between infection and death. We use partial pooling of information between countries with both individual and shared effects on the reproduction number. Pooling allows more information to be used, helps overcome data idiosyncrasies, and enables more timely estimates. Our model relies on fixed estimates of some epidemiological parameters such as the infection fatality rate, does not include importation or subnational variation and assumes that changes in the reproduction number are an immediate response to interventions rather than gradual changes in behavior. Amidst the ongoing pandemic, we rely on death data that is incomplete, with systematic biases in reporting, and subject to future consolidation. We estimate that, for all the countries we consider, current interventions have been sufficient to drive the reproduction number Rt below 1 (probability Rt< 1.0 is 99.9%) and achieve epidemic control. We estimate that, across all 11 countries, between 12 and 15 million individuals have been infected with SARS-CoV-2 up to 4th May, representing between 3.2% and 4.0% of the population. Our results show that major non-pharmaceutical interventions and lockdown in particular have had a large effect on reducing transmission. Continued intervention should be considered to keep transmission of SARS-CoV-2 under control.
https://www.nature.com/articles/s41586-020-2405-7
The effect of large-scale anti-contagion policies on the COVID-19 pandemic
Abstract
Governments around the world are responding to the novel coronavirus (COVID-19) pandemic1 with unprecedented policies designed to slow the growth rate of infections. Many actions, such as closing schools and restricting populations to their homes, impose large and visible costs on society, but their benefits cannot be directly observed and are currently understood only through process-based simulations2–4. Here, we compile new data on 1,717 local, regional, and national non-pharmaceutical interventions deployed in the ongoing pandemic across localities in China, South Korea, Italy, Iran, France, and the United States (US). We then apply reduced-form econometric methods, commonly used to measure the effect of policies on economic growth5,6, to empirically evaluate the effect that these anti-contagion policies have had on the growth rate of infections. In the absence of policy actions, we estimate that early infections of COVID-19 exhibit exponential growth rates of roughly 38% per day. We find that anti-contagion policies have significantly and substantially slowed this growth. Some policies have different impacts on different populations, but we obtain consistent evidence that the policy packages now deployed are achieving large, beneficial, and measurable health outcomes. We estimate that across these six countries, interventions prevented or delayed on the order of 62 million confirmed cases, corresponding to averting roughly 530 million total infections. These findings may help inform whether or when these policies should be deployed, intensified, or lifted, and they can support decision-making in the other 180+ countries where COVID-19 has been reported7.
https://www.nature.com/articles/s41586-020-2404-8
Izen: Well, that is certainly the only way it ever gets any public attention. Sometimes the apparent errors spotted are real errors (i.e. the divide-by-almost-zero in FUND, Reinhart-Rogoff fun with excel, etc).
But internally in science it is another story, computationalists spend their life struggling to get other people’s codes working, railing against poor documentation etc. Doesn’t affect results that often, just slows everything down.
So it is a real issue in some sense even if the talking points from the usual suspects are silly.
“Indeed Ferguson’s code sat on a shelf for 13 years: maybe if it was made available in a clean way, it wouldn’t have. Instead, it was suddenly resurrected in the middle of a pandemic: that seems non-optimal to me.”
It is, the problem is that society is unwilling to pay the up-front costs of having the software maintained before it is desperately needed. We live in a tax-averse world (at least in the UK). You can have low tax or you can have services, but you can’t have both.
“. Dismiss any actual mechanism for actually doing so as impractical or too expensive. ”
actually, the mechanism you proposed (“Just requiring that any grant that involves developing a significant piece of software has funding/support towards this end would probably be a good step. “) was the one I mentioned upthread.
It’s only impractical because society doesn’t want it enough to pay for it. The money has to come from somewhere.
Ben,
This is already happening. More people are making codes available. More people are using repositories, like github. I think it’s a fundemantally reasonable thing to do, but it seems more realistic for this to happen through changing practices within the community than through the imposition of some kind of regulation. There are some areas where I do think some kind of formal requirement might be good. For example, if someone is going to publish a paper based on a big computational model, then that model should be publicly available. This is already mostly the case, but there are still some exceptions.
I agree with ATTP. I have been making research tools available for twenty years – I think it is a good thing to do, and if I had more time and energy, then I would have done more of it. However, unless inducements are made available, it has to be accepted that the software was constructed to the author’s requirements, not yours, so don’t expect the software engineering to be any better than the author requires or user documentation (which the author generally doesn’t need).
Rather timely!
AutoMunge is such a great name! ;o)
FWIW, I also think ATTP’s response is sensible. Encouraging and enabling science practice to change strikes me as a productive and realistic approach.
Devil’s Advocate position:
Competition for research grants, publications, tenure, other rewards can be fierce. Some people involved in the process can be pretty parasitic.
I spend month or years collecting data, developing code, testing, etc. I release it all, and some parasite grabs it and produces a paper without putting any effort or resources into the job of developing it (field work, data cleaning, coding, whatever). And they don’t share authorship.
I get little in the way of rewards; the parasite gets the big grant, and fame and fortune.
I’ve been involved in large cooperative projects, and often there are two rules that apply:
1) I get to delay sharing things until I have had time to prepare publications and finish what I wanted the data/code for. (i.e., I get the first chance to reap the rewards).
2) If you use the data in a publication, you have to offer me co-authorship. (I shared my efforts with you; you have to share the rewards with me.)
Doesn’t get rid of parasites, but helps reduce the infestation.
Bob,
Yes, I agree that that is indeed one of the issues. The academic system is not very good at rewarding those who do lots of legwork to get stuff done but don’t get much opportunity to exploit what they’ve developed. What propose as (1) and (2) is often how things work in my field. A variant of (2) is that rather than someone getting co-authorship, you need to cite their paper. Another variant is that developers get authorship on a couple of early papers.
I suspect a lot also depends on the prospects for comercialisation of the research and patents etc. Climatologists are a delight to work with, very happy to share data and acknowledge collaboration, but sadly that hasn’t been the case in every field I have worked in (I find playing cricket with your collaborators is the key ;o).
“Climatologists are a delight to work with,”
I agree. They are essentially an incurious lot, leaving you alone so you can leisurely go about doing interesting research and thus take full credit when the time is right. Any other scientific discipline and you would have to keep on your toes. LOL
Pingback: Link blog: covid19, model, simulation, evangelicalism – Name and Nature
Ben McMillan: “Red herrings about standards for autonomous vehicles aside, I still don’t think it would require very big incentives (or any real extra money) to bring up a decent fraction of science codes to a reasonable standard in terms of packaging/documentation. Might not need more than a bit of nudging, given scientists spend a fair bit of time doing stuff that isn’t explicitly rewarded anyway.”
Having spent most of my career working in Silicon Valley startups, this seems incredibly naive. In my experience SW engineers do not document and package up SW unless forced. Standards are one way that industry and regulators force companies to do the work. The only companies I’ve worked at that had well documented code were the ones that were FAA regulated. Without that external driver, every engineer I’ve every worked with (with one or two very notable exceptions) has grumbled and dodged any responsibility to document their code.
FWIW, I am working on a hobby project at the moment (I spend too much time teaching programming and not enough time actually writing programs) and I am writing a LaTeX maintenance document at the same time. However that is because if I ever finish it, it is a project that I want to see maintained for as long as possible and whether it is me that is doing the maintenance or somebody else, I want to facilitate that by making it easy to find the necessary information. It’s probably the first and last time I will be doing that while I am actually writing the code (which is the best time to do it), as most of the programs I write are fairly transient, I don’t expect anyone to be interested in the code in five or ten years time (the ideas hopefully, but not the code). All software is written to a budget (even if only time and energy) and a good programmer is able to make the right trade-offs for the needs of each project.
… although they may need some persuading that having fun coding isn’t the primary “need” involved in the projet! ;o)
OK, so real old Fortran coder here.
I’ve seen some code with so many comment lines that the number of comment lines exceeds the number of actual code statements! So much so that I can’t see the underlying algorithms unless I remove all those comment lines.
There is a joke in there somewhere and here it is …
My coding skills are so bad that I never delete a line of code as I just comment it out! So much so that I can’t see the underlying algorithms unless I remove all those comment lines.
Yeah, I’m not really claiming that documenting doesn’t take much effort, I’m really saying that documentation will very often pay off (often to the same person who wrote the code a few years later), so the real net cost (in the long term and to the whole science community) of getting people to adopt better practices is somewhere around zero.
Basically, ‘it costs less to not document’ is usually incorrect and often shortsighted especially if other people’s costs are included. That is, forcing/convincing/encouraging people to do it right will pay off in the long term and for the collective science endeavor.
Peer review is one example of an important part of life as an academic scientist, not really considered optional, but not actually immediately useful for the person doing it, but essential for the whole enterprise. Or maintaining a lab book. Maybe writing documentation could be seen the same way, as an annoying chore but one that has to be done.
Current practice is to a large extent just whatever happens to be easiest at the time…
Current practice is to a large extent choosing short term gain and accepting long term pain. Especially if that pain is going to be felt by someone else. Get my rewards now, and let someone else pay.
Which sort of starts to look like the climate situation, doesn’t it? Or politics. Or corporate earnings. Or….
Ben wrote “ I’m really saying that documentation will very often pay off (often to the same person who wrote the code a few years later), ”
This simply isn’t true. Most research software ends up being largely unused after the project for which it was written, because it is being used for research, which means the specifications are unknown at the start and ideas and possibilities are constantly evolving so it never congeals to a finished form.
The vast majority of papers end up being largely ignored, with minimal citations, which suggests that the software used is of a similar level of interest, so documenting it is probably a worse use of your time than coming up with better ideas.
But that is just my experience of 25 years doing research and writing software for it.
“Peer review is one example of an important part of life as an academic scientist, not really considered optional, but not actually immediately useful for the person doing it, “
Actually, that isn’t true. You learn a fair bit by reviewing other people’s papers, Including how to write papers and communicate ideas in a way that other people will get.
The problem is not people stealing your stuff, the real enemy is obscurity…
“pick up the ball and run with it” would be my metaphor of choice (stealing would imply a lack of acknowledgement that it was your idea, which I don’t think we should be enticing people to do). It is why I make some of my research tools available (when I don’t it is because they are not in a fit state to share without exceeding my time/energy budget for providing support).
Ben, I responded to Caldeira’s challenge
Matt gives the lukewarmrr uncertainty treatment to COVID-19:
https://twitter.com/CT_Bergstrom/status/1270226183485976584?s=20
Joshua, interesting thread. I think Betteridge’s Law applies to Ridley’s initial tweet.
What’s that you say?
Matt Ridley, former Chair of Northern Rock bank, arguably the single biggest failure of Corporate risk management in British history, is lecturing us about the need to take more risks with policy on a deadly virus?
And similarly to his lack of financial expertise at the time, he’s doing this whilst ignoring expertise on virology?
Let’s just hope he doesn’t develop an interest in climate change, eh?
Dikranmarsupial
“Joshua, interesting thread. I think Betteridge’s Law applies to Ridley’s initial tweet.”
I propose Ridley’s law, which, while too specific to be of much general use, is surely useful. “Anything Ridley says is false”. With or without a question mark.
vtg,
Very droll 🙂
I see someone responded on Twitter to Ridley’s Panglossian line with a shorter version of the point I made a few threads ago. A disease which kills a lot of the socially active breeders among its host, or just keeps them isolated and immobile when infectious, has a selection pressure favouring more infectious but less lethal/less debilitating strains. One that mostly kills people who’re less socially active and whose breeding days are behind them, and in which half of cases are asymptomatic, not so much. Covid-19 is spreading just fine, with a transmission rate almost double flu despite being ten times more deadly. Once TTI is properly in place, the main selection pressure should be for variants which are more infectious among children and asymptomatic adults, and/or with a longer period of pre-symptomatic or post-symptomatic infectivity. And of course drug-resistant variants.
It’s almost like Matt can’t do maths, let alone game theory. Maybe that explains Northern Rock. Or perhaps even biology, which I believe was his PhD topic decades ago (mating system of the pheasant according to Wiki – you’d have thought game theory came into it, but I suppose it was a long time ago).
Ben McMillan
“Basically, ‘it costs less to not document’ is usually incorrect and often shortsighted especially if other people’s costs are included. That is, forcing/convincing/encouraging people to do it right will pay off in the long term and for the collective science endeavor.”
Are you speaking of industry software here, or software written by academics for use in their research?
Industry sets a very low bar, which I’ve mentioned before. In fact, so low that I’d suggest that the IC model might actually be better than much of the code our modern world is built upon.
For instance, containerization has been all the rage for quite awhile now. containerd is steadily replacing dockerd due to being lighter weight etc. Go look at the source. I dare you. Read the comments in the code and come back to us :). Or, start with the high-level documentation describing how the code is structured, the underlying design, etc. Read that and get back to us. I dare ya. It won’t take you long at all …
An entire world of commercial applications are being deployed by this software. Quite likely, your bank’s, actually.
Now, as it turns out, containerd is apparently very reliable, even though documentation is nearly non-existent and the innards aren’t for the faint-hearted. Some, perhaps even me, would say that this is what counts the most.
But as far as all these high-falutin’ suggestions for improving academic software, perhaps it would be best to be quiet until we’re finished replacing all of the shattered windows in our own glass house.
VTG and dhogaza well, quite! ;o)
BTW, I would be very interested to see some good documentation on the internal workings of the deep learning libraries that are in widespread use. There are lots of recipe books, but I would love a book that went through how the libraries worked and how they were structured.
Matt Ridley’s continued prominence has always amazed me. Why, for example, was Fred Goodwin seen as a pariah, but Matt Ridley was subsequently elected to the House of Lords and still has a regular column in a major newspaper (and regularly writes for other media outlets). What do you actually need to do in order to be regarded as someone whose views are not worth promoting?
I suspect that was a rhetorical question ;o), but I think it is probably more to do with whether people back down when shown to be wrong. There is always an audience for crackpot views, as cognitive biases dominate many peoples thinking (unless they actively work to prevent it), so all you have to do to be regarded as someone whose views are worth promoting is to ignore criticism, play to prevalent cognitive biases and let your potential promoters find you.
” What do you actually need to do in order to be regarded as someone whose views are not worth promoting?”
Give a rational, dispassionate analysis of the available information, taking uncertainties into account, and conclude that society should do something most will find unpalatable? ;o)
Matt Ridley’s continued prominence has always amazed me. Why, for example, was Fred Goodwin seen as a pariah, but Matt Ridley was subsequently elected to the House of Lords and still has a regular column in a major newspaper (and regularly writes for other media outlets). What do you actually need to do in order to be regarded as someone whose views are not worth promoting?
Weird isn’t it.
Certainly it’s nothing whatsoever to do with the fact that Fred was the son of an electrician and went to the local grammar school, whereas Matt is an aristocrat who went to Eton, shares a social network with prominent right wing politicians, and holds a nepotistically allocated place in parliament.
No sir.
Oh, not the documentation!
In the “it’s a feature, not a bug!” department: Jerry Pournelle was a science fiction writer that waded seriously into the use of microcomputers early in the 1980s. He had a column in BYTE magazine (when computer magazines were magazines). I remember him writing about a trip to a major computer show where he talked to someone in a booth that was hawking a new software product. The sales droid said “…and the documentation was written by the programmer!”. Jerry’s comment was “Alas, this appeared to be true.”
We live in a world where software with a button labeled “Frobnitz Gleabinator” thinks it’s being helpful when the balloon pop-up tells you “This will Gleabinate the Frobnitz”. Properly-written context-sensitive help systems have been replaced by search engines. Every new version of Office makes the help system less and less useful. Check boxes say things like “Optimize”, and you can’t find out what it is trying to optimize for.
I was impressed when Windows 95 introduced the “Windows Troubleshooter” – until I tried it a few times. Every suggestion it gave evoked the thought “I’ve tried that already”, until I reached the point where it said “You have encountered a problem that the Windows Troubelshooter cannot help you with”. It was mislabeled: it was the “User Troubleshooter”. It was based on the assumption that the user needed help on how to do it correctly. It was no help at all when the problem was that Windows wasn’t working properly.
Good documentation takes time, and costs money. Society wants the low-cost option, but is unhappy with the result.
On a related note Robert Heinlein, I think, had a trope in one of his novels about a spaceship run by an AI which for safety reasons required any potentially dangerous operation like opening the airlock doors to be confirmed by giving a voice instruction three times. Unfortunately, the AI complied if you simple prefaced the instruction with “I tell you three times”.
I was once on the board of directors for a small volunteer group. Each year, at the first meeting with the new board, we moved (and seconded) a motion saying that for the rest of the year motions did not need to be seconded.
New Phil. Trans Royal Soc paper “Climbing down Charney’s ladder: Machine Learning and the post-Dennard era of computational climate science”. I was hired by IBM Research to investigate high-speed materials and shared an office with Robert Dennard before he retired. Cut to today and IMO it’s the algorithmic breakthrough NOT speed that will provide the breakthrough.
The Balaji paper is mainly insights as to what direction climate science will take. As Ben said the following is likely true — you can’t keep throwing horsepower at a problem that is only obscurely understood and tended to by gatekeepers of “ever more elaborate models”.
Note that machine learning applied to climate science is fairly dumb — it’s not implying any particular physical insight.

So why would it even matter if the software is understandable if it can give the right answer? The necessary pattern matching mechanism could have been added accidentally and no one would be the wiser (and no one would know exactly what it was that made the difference). Same thing as happens with machine learning — no one has any idea why it works when it does “just seem to work”.
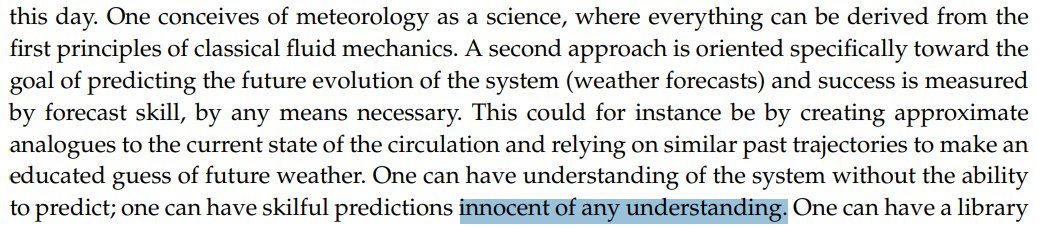
Balaji references a NOAA paper claiming that “with little additional effort … anyone can be a climate forecaster” ! The “model-analog” approach is that you dig up an old model run from the archives and you check to see if it matches recent data (such as ENSO) and then extrapolate
Unless there are simpler models available, no one will steal anything (as Ken Caldeira seems to want to happen). And if there is no scientific curiosity or drive to want to do better, there it will sit, and the stasis will continue.
Concluding challenge in the Balaji paper:
To return to research code documentation, I mentioned upthread how I did write code in the 80s that was meant to be open sourced and was documented. But I wonder how useful the comments would be to someone from another field, even a professional programmer, who was parachuted in? I probably omitted a lot that’s obvious to One Ordinarily Skilled In The Art (where the Art here is basin modelling and structural restoration, not FORTRAN programming). I have a copy due to the chance chain of events I mentioned, and when I retired I decided as it was still on open file somewhere there was no harm in taking it home in case I wanted to play with it (of course I never did). So I dug some out and will post just the comments from some parts. I’ll do them as separate blocks, first trying straight pasting of the 80-column source to see if it goes horrible on the web and I have to do some clean-up.
The first is from the decompaction engine, a key part of the software. Neither it nor the associated reports talk about why I do it that way. I refer to published papers, in the same way the Ferguson paper referred back to his mid-2000s publications. That’s where you should go for a plain-language explanation of what it does, not go to git-hub and reverse-engineer it.
You need three layers to backstrip, the target layer, the one above which you remove so the target decompacts as it goes to shallower depths, and the one below because it decompacts too and you have to adjust the target layer for that. To scale up to more layers you just add more loops and more iterations. I only had two available in my test dataset, so I used a constant thickness for the underlying layer. In retrospect I should have made a grid with the same node locations as the other two, and just filled it with constant values. That’s a trivial edit though, replacing a 1D variable with an array variable.
C***********************************************************************
C BASIN3
C
C PROGRAM TO YIELD AVERAGE DECOMPACTED THICKNESSES WITHIN THE BASIN
C AND AT THE BASIN MARGINS FOR THE STRATIGRAPHIC UNIT BETWEEN TWO
C SPECIFIED HORIZONS. THE SHALLOWER HORIZON IS RESTORED TO SEA
C LEVEL USING AN EXPONENTIAL COMPACTION FORMULA FOR WHICH THE
C PARAMETERS PHI (POROSITY AT SEA LEVEL) AND C (EXPONENTIAL FACTOR)
C MUST BE SPECIFIED. MAP1.DAT CONTAINS PRESENT-DAY DATA FOR THE
C SHALLOWER HORIZON, MAP2.DAT CONTAINS THE DEEPER HORIZON. A
C SEQUENTIAL FILE BDY.DAT MUST FIRST BE CREATED,
C CONTAINING DEPTHS TO THE SHALLOWER HORIZON AT THE X,Y POINTS
C CORRESPONDING TO THE BOUNDARIES OF THE DEEPER MODEL.
C LIKEWISE BDRY.DAT CONTAINS DATA FOR THE DEPTH TO THE DEEP
C HORIZON AT THE SHALLOW BOUNDARY POINTS
C IT IS ASSUMED THAT THE JURASSIC INTERVAL IS TO BE DECOMPACTED,
C AND THAT IT HAS TO BE CORRECTED FOR THE SUBSIDENCE DUE TO
C SYN-JURASSIC COMPACTION OF A SPECIFIED DEPOSITIONAL THICKNESS OF
C PERMOTRIAS WHICH IS PRESENT ONLY WITHIN THE BASIN
C THE PROGRAM ALSO CALCULATES MEAN DEPTHS TO UNC CIMM WITHIN AND
C OUTSIDE THE BASIN AFTER DECOMPACTING THE JURASSIC AND PERMOTRIAS,
C AND A MEAN DEPTH TO BASE JURASSIC WITHIN THE BASIN AFTER
C DECOMPACTING THE PERMOTRIAS
C
C***********************************************************************
C READ DECOMPACTION PARAMETERS
C
C GRID DATA (WITHIN THE BASIN)
C
C ONLY ACCEPT POINTS FOR WHICH BJ THICKNESS IS AVAILABLE
C
C DECOMPACT JURASSIC TO SEA LEVEL
C
C DETERMINE DEPTH TO BASE PERMIAN AT END JURASSIC
C
C CORRECT JURASSIC THICKNESS FOR COMPACTION OF PERMOTRIAS
C
C DETERMINE PRESENT-DAY DEPTH TO BASE PERMIAN
C
C CORRECT BASE J DEPTH FOR COMPACTION OF PERMOTRIAS
C
C DECOMPACT PERMOTRIAS AND JURASSIC TO SEA LEVEL
C
C CORRECT UNC CIMM DEPTH FOR COMPACTION OF JURASSIC + PERMOTRIAS
C
C DECOMPACTED JURASSIC THICKNESS
C
C DECOMPACTED DEPTH TO BASE JURASSIC
C
C DECOMPACTED DEPTH TO UNC CIMM
C
C BASIN-MARGIN DATA
C
C JURASSIC BASIN MARGINS
C
C SELECT FIRST BOUNDARY
C
C DECOMPACT JURASIC TO SEA LEVEL
C
C SELECT LAST BOUNDARY
C
C DISTINGUISH ROWS FROM COLUMNS
C
C DECOMPACT JURASSIC TO SEA LEVEL
C
C DECOMPACTED JURASSIC THICKNESS ON BASIN MARGINS
C
C UNC CIMM BASIN MARGINS
C
C SELECT FIRST BOUNDARY
C
C DECOMPACT JURASSIC TO SEA LEVEL
C
C SELECT LAST BOUNDARY
C
C DISTINGUISH ROWS FROM COLUMNS
C
C DECOMPACT JURASSIC TO SEA LEVEL
C
C CORRECTED DEPTH TO UNC CIMM
C
SUBROUTINE DECOMP (C,F,LAB,TRY,ZJ,ZK,ZOLD,ZTOP)
Hmm, that’s rather sparse. It was towards the end of the project because you have to do lots of other stuff to get that far so perhaps I was losing the will to live, or at least the will to comment copiously. That last line is obviously not a comment, and no the comments for the subroutine that does all the work are not in another file that gets called – there are no comments. It’s FORTRAN. FORmula TRANslation. It doesn’t need any comments. All that subroutine does is run a bunch of maths that’s documented in the report and the underlying papers, inside a loop. It’s assumed that OOSITA knows how to go between FORTRAN syntax and equations, and can check the equations for correctness. A lot of scientific software is probably like that – most of it is data preparation and management, the equations are well known and can be compactly rendered in FORTRAN. It’s what it’s good at. All the cruft around them is the hard stuff, especially in F77 which I was using, and even more so in FORTRAN IV which was my first exposure. The bits that do the work are just assignment statements, data I/O, IF statements, DO loops and mathematical equations.
LAB and TRY don’t get defined but by then I’d used them multiple times in previous programs so must have got sloppy. LAB is the maximum number of iterations of the decompaction solver (there’s no closed-form solution for decompaction, although there is for compaction which is why that functional form was used – kinda like some functions are easy to differentiate but hard to integrate). It writes a label so I can identify nodes which didn’t converge and choose to include or exclude them. TRY is the convergence criterion – I would try 1m, try 5m, try 10m etc.; remember, I was very hardware-constrained.
This part of the software doesn’t need to differentiate rows from columns, but others do and I see I’ve kept the same structure here. I’d like to say that was me being systematic, but it was probably just me re-using the data management and I/O template and changing the calculation part.
Who would these comments be useful to? Me, going back over it months or years later. Someone wanting to understand it and modify it, for example using a different compaction model. An Auditor trying to make it conform to some Standard? Probably not.
Dave_Geologist
“C PROGRAM TO YIELD AVERAGE DECOMPACTED THICKNESSES WITHIN THE BASIN”
You said it was a FORTRAN PROGRAM. Now I know not to trust anything you write! 🙂
I did caution about html messing it up 😉 .
The original text had five spaces between the C and the P. That would have made it obvious 🙂 .
And the SUBROUTINE line would have been a dead give-away because the six leading spaces were mandatory, not just for style as they are in a comment. That actually caught me out when I started that project. It was some years since I’d used FORTRAN, and it was the first time I’d coded at a terminal rather than on a card-punch. IIRC our card-punches had a special key to jump in six spaces. So I wrote the first program without leading spaces and wondered why it wouldn’t compile 😦 .
Now if it had been Unix rather than VMS I could have used nedit to replace CR with CR (that was five spaces but they won’t show). For those unfamiliar with the delights of nedit, it lets you select invisible characters from the gui and copy-paste them into find and replace boxes. You can also select columns of text or figures using CRTL-MB, and infill the selection by going to the bottom and using CTRL-SHIFT-MB (heheh, just tested it there). Although weirdly, in my currently installed version (Debian (1:5.7-2)) it only does that if the text is ALL CAPS. I’ve never really had cause to use that functionality other than in data tables, so maybe it was always like that.
Real Men™, of course, never used anything other than vi 😉 .
VMS did have a customisable editor in EDTINI, which partially made up for the lack of nedit (which I didn’t miss because I didn’t know about it at the time). And compensated for the fact that the basic EDT used different conventions and hot-keys to the VMS mail and word processor app All-In-1, so I made my EDTINI match All-In-1. You’d have thought that the teams would have talked to each other, or the All-In-1 developers read the, ahem, EDT/VMS documentation. Hell, they probably wrote the code using EDT!
OMG a quick Google shows me All-In-1 could be integrated with SAS (All-In-1 also had a spreadsheet, so I presume you used that to make the data tables). Now that was another annoyance. SAS script syntax was, to borrow from Douglas Adams, almost exactly, but not quite entirely, unlike FORTRAN. IOW close enough to slip into using the wrong syntax if you were working with both. And don’t get me started on RMS vs. Gocad scripts – three decades on, nothing changes.
And now I’m really going down memory lane because I’ve remembered writing reports for external distribution in DECpage. A primitive desktop publisher, with hierarchical sections, non-proportional fonts for a laser printer and more, all tediously implemented using manually inserted mark-up tags.
Still, enough nostalgia for now 🙂 . Time for a cuppa.
FORTRAN continuation statement from previous punch card was in column 6.
Another old-timer 🙂 . Yes, that should have been CR then six spaces in my nedit musings. As an additional QC tool, I recall that some cards had a stripe in column 6 so you could easily check the number of spaces. And I vaguely remember holding stacks of cards up to the light to see if there were any outliers. When you had to leave your cards in a tray and come back hours or days later for the result of a run, there was a strong incentive to avoid typos!
This is dated June 8th, so not sure if it got already mentioned, but
‘Critiqued coronavirus simulation gets thumbs up from code-checking efforts’
https://www.nature.com/articles/d41586-020-01685-y
Also:
‘On scientific software – reproducibility’
https://www.bnlawrence.net/academic/2020/06/software4/
BTW: my ex-boss was fond of using a minus sign as a continuation character in long formulae. Doing that in combination with some terms to the right of the last column and some unexpectedly implicitly typed variables and you can really mess with someone’s head.
ATTP, is it straightforward to run the code with different R0 values? In light of the Telegraph article, it would be interesting to try 2.0-2.6 (ie the values in the Ferguson paper) and see what they actually come up with in terms of doubling times etc…
https://www.telegraph.co.uk/news/2020/06/14/scientists-warnings-spread-coronavirus-uk-drowned/
Ah, maybe spam-blocked due to URL?
@jamesannan
The new release of the ICL model has the exact model parameters that Ferguson ran for his Report9. I managed to get these running on my iMac but have just ran the R=2.4 value. It is clear that everyone SAGE included thought the UK was 3-4 weeks behind Italy. The IC model runs predicted the peak of infections to occur in May rather than in April. Partly that is because R0 for the UK turned out to be 3.0, but mainly because we were blind to the fact that thousands of infections imported directly from Italy, Spain and France before March.
more: http://clivebest.com/blog/?p=9590
and: http://clivebest.com/blog/?p=9605
James,
I did that already. I’ll try to put a figure together.
James,
Here’s a plot showing the infections for R0 values of 2, 2.4, 2.5, 2.6 and 3. I get doubling times of 3.7 days for R0 = 2, around 3.4 days for R0 = 2.4 and R0 = 2.5, 3.3 days for Ro = 2.6, and 3.2 days for R0 = 3. I’ve only run a single realisation for each R0 value, so could rerun some of these more times to get a better average.
James,
Do you know what the generation time in Kit Yates’ tweets refers to? He mentions it being 6.5 days, but I can’t seem to find what parameter in the CovidSim data files might be equivalent to this.
Okay, it’s related to the infectiousness profile, which I can find in the parameter file. However, I can’t seem to work out how to turn that into some kind of mean generation time.
Clive,
Are those suppression scenarios, or mitigation scenarios?
ATTP,
They are all suppression scenarios. The mitigation are off the scale on this plot.
I also realised what the excursion “waves” are. Ferguson was simulating lockdowns triggered by a upper threshold in no of cases(or deaths) and then relaxed again when the number of cases fall below a low threshold. So this is a neverendademic !
Clive,
Thanks, I thought so. Yes, in the suppression scenario there are ICU triggers that turn interventions on and off. If you look at Table 4 in Report 9, these are on for more than 50% of the time and, in some cases, more than 90% of the time.
“So this is a neverendademic !”
That is not impossible. If immunity goes away in around 40 months, not impossible, then there could be annual outbreaks of SARS-CoV-2 until there is a vaccine.
ATTP, I don’t believe those values you quote can be right. There must be something else changing or changed.
6.5 is a diagnostic of the model, not a parameter. There is a 5.1 day latent (pre-symptomatic) period and also 4.6 pre-infectiousness period mentioned in paper which may be identifiable – ie infectiousness starts half a day prior to symptoms. But then the infections happen according to some distribution after that time, giving an overall 6.5 day average interval.
If you use R=2 with a 6.5 day average, it takes 6.5 days to double. There may be room for a little bit of a wiggle in the precise value if the infectiousness profile is odd but there’s no way that it can double in under 4.6 days with R=2 if people don’t infect anyone at all inside that time interval!
James,
I thought the 4.6 was the 5.1 minus the half day prior to symptoms. I have found the infectiousness profile numbers, but I don’t know how to turn that into a mean generation time (it may not be possible from those numbers alone).
James,
Okay, I’m partly through running it again and it does look as though the doubling time is longer than I said in that earlier comment. Not quite sure what I did in those other runs. Let them finish and I’ll post an update later.
Okay, I think I’ve reproduced the R0 = 2.4 run that was included in the paper and that gives a doubling time of just over 4 days. (4.14 days) I’ll do the other R0 runs and see what I get.
I’ve also found an output variable called TG, which may be the generation time. Although the average across the period of the simulation when the infection is present is around 6.5, the value during the early phases is more like 4.5.
ATTP, what are the infectiousness profile numbers?
They’re in this parameter file.
https://github.com/mrc-ide/covid-sim/blob/master/report9/GB_mitigation/preGB_R0%3D2.0.txt
(if it’s a file on github somewhere maybe that’s easier than copying it…depending what it looks like).
That’s what I thought I’d done 🙂 Are you looking for the input parameters or the output numbers?
Yes thanks cross-post. It looks reasonable. Based on the silly Telegraph comment I had wondered if thy had played silly buggers with this distribution – you can get a shorter doubling time by skewing it even for a given mean interval.
ATTP, what are the infectiousness profile numbers?
I think I know the answer.
Oh, not the documentation!
One nice thing about R is that you cannot publish a package unless you do the documentation
according to the specification
.
and of course there are now tools to help you automate the writing of the documentation
Roxygen
Long ago I wrote a bunch of R packages. so glad they forced me to do documentation
I have to say, watching Clive, James and Ken on the hunt does remind me of better some episodes of climate audit. ( minus some of the bad aspects)
puzzles are fun
James,
I have rerun the no Intervention scenarios for R0 = 2, 2.4, 2.6, 2.8, and 3. The doubling time during the earlier phases on the infection vary from 3.4 days for R0 = 2, to 4.3 days for R0 = 3.
ATTP:
“3.4 days for R0 = 2, to 4.3 days for R0 = 3.”
Doubling time gets longer as R0 goes up???
dhogaza,
Well spotted. Other way around; 4.3 days for R0 = 2, and 3.4 days for R0 = 3.
ATTP, can you plot out the death curve for the UK as in their paper? These numbers don’t seem very plausible, given that they state there was a latent period of 4.6 days. I get a very precise fit to their figure 2 (for R0=2.4) with a doubling rate of 4.7 days, and this value is pretty much compatible with their published numbers. (naive estimate would be 5.1 days based on a serial interval of 6.5 and R0 of 2.4, but the distribution of infectiousness profile can reduce this a bit).
sorry I actually mean fig 1 though I suppose anything would do for validation
Here’s the equivalent of their Figure 1, but for R0 values of 2.2, 2.4 and 2.6. I think their figure 1 was probably using R0 = 2.4.
Thanks….your claim is that the doubling time for the R=2.4 picture is …something under 4 days? have you looked at the numbers or is this some sort of automatic diagnostic? I get a near perfect match to both your pic and the original fig in their manuscript with my 4.8 day doubling run, and there is no question when I try to overlay the result that my results are growing more rapidly than the 2.2 run in your figure.
James,
I’m doing it from the infection data. I may be making some kind of silly mistake, but when I look at the numbers it seems about right. I’ll have another look.
Okay, maybe I’m being dense, but if I do the calculation using the daily death data, rather than the infections, then I do get longer doubling times (4.5 to 5.5 days). Does that make any sense?
well…that is ….odd. I could see it happening over a short time where the infection is shifting from one sector of the population to another but that can’t sustain for long. The whole point of a growth rate is that the system can be described through linear algebra with a dominant eigenvalue. In the SEIR model it takes about 3 weeks for the growth rate in deaths to converge to the same as all other components (due to the time to death delay). I wonder if the calculation for cases is affected by the seeding?
What about the age distribution. Could it be that infection runs through the different age groups slightly differently and, given how the infection fatality ratio depends on age, you could end with a different doubling time for infections and deaths?
That’s basically what I said. But it’s still contrary to the underlying way these things work. Over what sort of period do you get 4 day doubling in the R0=2.4 case? How does this change over time? I can only think it is a residual from the initialisation before it’s had time to converge to the dominant eigenvector/value.
James,
Sorry, I misunderstood what you were suggesting. Below is a plot of the doubling time for cases and deaths. I’ve shifted the deaths so that it’s on the same time axis (they’re shifted back by 50 days). I’ve calculated the doubling over a period of 20 days, and the figure shows a period of 40 days.
Certainly, when I’ve been looking at the age-dependent data, it does seems that a larger fraction of the younger age groups get infected, compared to the older age groups, which may explain this difference.
Okay, if I shift the time difference between when I calculate the doubling time for the cases and the deaths to be only 20 days, then you do get a more similar doubling time. Maybe I’ve been calculating the doubling time for the cases too early in the infection.
I would be very careful with doubling times, particularly if RoW has a doubling time of ~27 days and a death toll of 145.5k as of 2020-06-16…


The black dashed/solid lines are my so-called line in the proverbial sand. The black line represents a straight line exponential fit to 43-days of RoW doubling times as shown in the 2nd figure. It is not meant to be anything special, except for the fact that if RoW does not rise above that line then RoW will have an excess of at least 500k deaths by the end of 2020.
The 1st figure shows an overall picture of the JHU COVID-19 data to date. I fully expect the RoW doubling time to flatline or even drop over the next three days. The multiple lines in the lower two graphs of the 1st figure give some context to the current RoW doubling time fate, the lines represent the series expansion for the line in the sand exponential, e, g. “B9” is the sum of the 1st nine terms (plus the B0 constant).
IMHO Brazil is undercounting deaths per recent news reports. That is all.
Thanks for those! I’m surprised that the rate takes so long to converge to the asymptotic value. Still, it does what it does. I believe a slowing down would normally indicate an approach to herd immunity in at least one sector of the model (eg say 10% infected to be noticeable). I wonder if other factors like changes in mixing (school holidays?) could play a role. Anyway, something slightly north of 4.5 for the death rate (at least past mid-March which is when they tied the initialisation to) looks consistent with what I had calculated. It seems like they go past 1 death per 100k (ie 650 total) about mid-april, whereas in reality we passed that point a full two weeks earlier, which is quite a substantial error to have built up from a 16 March forecast.
Beautiful website:
https://reichlab.io/covid19-forecast-hub/
ooooooooooo
nice find williard
538’s been using the covid-19 forecast hub for a few weeks, it is good.
DH,
cuomo did a nice number on models last night. Sadly he will end his daily briefings.
I had doubts that a politician could do fact based briefings. he was pretty good ( B-)
I recently posted an assessment of COVID-19 evidence that had accumulated over the past few months. That post largely focused on the infection fatality rate (a.k.a. IFR; this represents the proportion of people infected with the virus SARS-CoV-2 who then die of the disease COVID-19):
So I want to do the same for Ferguson et al.’s work at Imperial College, in case people come along later to read about this topic:
1)
Ferguson et al.’s work was replicated (in large part thanks to Ken Rice, who runs this blog):
https://www.nature.com/articles/d41586-020-01685-y
https://www.medrxiv.org/content/10.1101/2020.06.18.20135004v1
2)
They did not over-estimate the IFR for COVID-19; instead, they very likely under-estimated it, especially once one takes care facility deaths into account.
Ferguson et al.’s IFR was ~0.9% for Great Britain:
Click to access 2020-03-16-COVID19-Report-9.pdf
Observed seroprevalence-based IFR, including taking age-stratification into account:
https://www.medrxiv.org/content/10.1101/2020.07.23.20160895v3
https://www.medrxiv.org/content/10.1101/2020.08.12.20173690v2 [see supplementary table S2(a)]
https://doi.org/10.1016/S2468-2667(20)30135-3
https://www.medrxiv.org/content/10.1101/2020.05.03.20089854v4
3)
Ferguson did not over-estimate IFR by over-estimating COVID-19 deaths on the Diamond Princess, contrary to Nic Lewis’ false claims and his exploitation of right-censoring (in which he didn’t wait long enough for Diamond Princess passengers to die of COVID-19).
Ferguson et al. rely on Verity et al.’s work for their IFR estimate:
Click to access 2020-03-16-COVID19-Report-9.pdf
https://www.sciencedirect.com/science/article/pii/S1473309920302437 [ https://web.archive.org/web/20200701065815/https://www.medrxiv.org/content/10.1101/2020.03.09.20033357v1.full.pdf ]
Verity et al. predict 12 – 13 deaths on the Diamond Princess. Lewis predicts ~8 deaths, due to his exploitation for right-censoring, along with the strange idea that such a small sample of deaths would match the precise time-course of a model-based prediction of deaths, as opposed to just matching the model’s predicted total deaths:
14 deaths happen (13 under Japan’s purview, and 1 under Australia’s):
https://science.sciencemag.org/content/368/6498/eabd4246.full [ https://web.archive.org/web/20200806195258/https://en.wikipedia.org/wiki/COVID-19_pandemic_on_Diamond_Princess ; https://www.thelancet.com/journals/laninf/article/PIIS1473-3099(20)30364-9/fulltext ]
4)
Ferguson did not over-estimate R0 for SARS-CoV-2; they instead very likely under-estimated it (in layman’s terms: a higher R0 means a virus is more contagious; so this means Ferguson et al. under-estimated how contagious SARS-CoV-2 is at baseline, and thus under-estimated how many people it would initially infect):
https://www.medrxiv.org/content/10.1101/2020.06.18.20135004v1
https://archive.is/8B7ZI#selection-595.0-619.21
https://www.mdpi.com/2076-3417/10/15/5162/htm [see section 6.1]
5)
Ferguson et al. very likely under-estimated the number of COVID-19 deaths that occurred under a lockdown, especially given points 2 – 4 above:
https://archive.is/8B7ZI#selection-595.0-619.21
https://twitter.com/DocMelbourne/status/1290428761230499840
6)
It’s ridiculous to say they over-estimated deaths in Sweden by using an apples-to-oranges comparison between Ferguson et al.’s non-mitigated scenario in which behavior and policy don’t change vs. Sweden’s observed mitigated scenario where behavior and policy changed. It’s similarly ludicrous to claim they over-estimated USA COVID-19 deaths by comparing Ferguson et al.’s projection of ~2 million USA COVID-19 deaths under a non-mitigated scenario vs. the USA’s fewer deaths under its observed mitigated scenario.
More on Sweden’s public health interventions and behavior changes:
https://www.folkhalsomyndigheten.se/the-public-health-agency-of-sweden/communicable-disease-control/covid-19/
https://www.statnews.com/2020/07/15/covid19-accidental-sweden-fall-could-be-catastrophic/
Click to access 2020.05.27.20114272v1.full.pdf
http://archive.is/yo5Ac
Click to access 2004.09087.pdf
http://archive.is/rk1dQ#selection-3637.0-3893.22
http://archive.is/OJupR#selection-1387.0-1513.5
http://archive.is/NvRhX#selection-4538.1-4538.2
Atomsk –
An important factor for Sweden could be their policy of not treating ill, elderly patients in a manner that they would be treated in most other countries. Essentially, it seems, they provide very minimal treatment, to the point of not giving them oxygen, not moving them from elderly care facilities to ICUs, etc.
It would seem that such a policy would lead to more deaths, thus in a sense supporting the viability of less stringent stay at home orders – in that if in Sweden they followed the health care practices of other countries (certainly in the US such a policy would not be politically palatable, particularly on the right) it might bring their deaths down – particularly since a high % of deaths in Sweden were among older people.
But IMO what it really shows is that cross-country comparisons, at least at this stage with the amount of evidence we have, serves not much purpose other than to serve as fodder for confirmation bias in support of political predispositions. There are myriad explanatory or predictive variables in play, and they likely play out with an even more complex set of interactions that get impossibly complex when you mix in country- or culture-specific factors. Trying to compare outcomes in Sweden with the US as compared to Korea as compared to Italy as compared to…is really like herding cats, IMO.
Nic tries to dance around the political ideology underpinning his technical analysis and the conclusions he draws. He never responds to critique of that interplay. It’s unfortunate but interesting that he declines to engage on that topic.
@Joshua
I didn’t compare Sweden to other countries in my comment. But I’ve made the comparison elsewhere, so I can cover it here at well, since you brought it up. This isn’t about political predispositions; it’s just biology, epidemiology, etc. of the sort that applies to a number of other contagious pathogens. To summarize in a paragraph:
It’s not enough to point out that Sweden’s healthcare system provided less intensive treatment to many elderly COVID-19 cases in care facilities: one needs to account for why Sweden had so many of those cases, while Finland, Noway, Denmark, etc. didn’t. Relative to nearby countries like Denmark, Norway, and Finland, Sweden pursued a less restrictive policy that allowed for a greater rate of community-wide SARS-CoV-2 infections. That increased the chance that elderly people who went out would get infected, as would care facility staff who went to purchase groceries, etc. Those facility staff would then bring the infection into the facility, infecting the elderly people there. So when one allows for more community-wide infection, one increases the risk to those residing within care facilities in said community.
Lewis either does not recognize this, or he willfully avoids it, even though epidemiologists emphasized it for months. He doesn’t draw the connection between the lax strategy he defends (a strategy he admits allows for more community-wide infection) and the increased nursing home infections + COVID deaths that result from said lax strategy. Lewis instead notes the effect, without addressing a major contributing cause:
http://archive.is/dO5A3#selection-2405.0-2405.254
http://archive.is/X9YvI#selection-7253.0-7277.359
That’s one way I can tell he lacks expertise in this topic, and that his position is primarily shaped by his political ideology.
Policy responses and effects in Sweden vs. nearby countries:
https://www.medrxiv.org/content/10.1101/2020.05.27.20114272v1.full
https://ourworldindata.org/policy-responses-covid
https://voxeu.org/article/effectiveness-lockdowns-learning-swedish-experience
http://archive.is/OJupR#selection-1387.0-1513.5
http://archive.is/NvRhX#selection-4538.1-4538.2
Sweden’s higher rates of SARS-CoV-2 infection (based on seroprevalence) vs. nearby Scandinavian countries Denmark, Norway, and Finland:
https://www.folkhalsomyndigheten.se/folkhalsorapportering-statistik/statistik-a-o/sjukdomsstatistik/covid-19-veckorapporter/
https://www.fhi.no/studier/prevalensundersokelser-korona/resultat—moba/
https://www.medrxiv.org/content/10.1101/2020.07.23.20160895v4.supplementary-material , supplemental appendix H
High infection rate among Sweden care facility staff:
https://www.tandfonline.com/doi/full/10.1080/20008686.2020.1789036
Correlation between community-wide infection vs. COVID-19 deaths and/or cases in care facilities:
https://onlinelibrary.wiley.com/doi/epdf/10.1111/jgs.16752
https://www.health.ny.gov/press/releases/2020/2020-07-06_covid19_nursing_home_report.htm [see the linked report PDF]
https://jamanetwork.com/journals/jama/fullarticle/2767750
https://web.archive.org/web/20200629035817/http://www.providermagazine.com/news/Pages/2020/MAY/Facility-Location-Determines-COVID-Outbreaks,-Researchers-Say.aspx
Other warnings on how preventing community-wide infection protects those in care facilities:
http://archive.is/szKEp [ https://jamanetwork.com/journals/jama/fullarticle/2766599 ]
https://www.theguardian.com/commentisfree/2020/mar/15/epidemiologist-britain-herd-immunity-coronavirus-covid-19
https://onlinelibrary.wiley.com/doi/epdf/10.1111/eci.13302
Atomsk –
Again, thanks for the links (some of which I’ve already seen).
Yes, I fully agree that comparing Sweden to it’s Nordic neighbors makes much more sense. I don’t think that comparing it to countries in the EU or Asia or North America makes much sense. For example, when comparing Sweden to the US, how do you factor in the vastly different SES factors, race/ethnicity, rates of comorbidities (or baseline health status), % of people who live in single-person households, # of grandparents who serve as primary caregivers for their grandchildren, access to quality healthcare, etc.?
Some people would want to project Sweden’s higher per capital death rate to the US (or the UK) and argue that the resulting tens of thousands of increased deaths from following Sweden’s path would be a worthwhile trade-off for less economic damage. Well, even looking past the dubious assumption that it would result in less economic damage, the simple projection would seem highly dubious to me. Sweden had multiple intrinsic advantages for a “herd immunity” strategy than the US or many other non-Nordic countries. A simple projection would likely be way low. My guess is that the resulting deaths here would be much higher than what you’d calculate by using the per capita death rate from Sweden with the US population numbers.
Back on March 25, Nic Lewis made a big deal about how Ferguson et al. and Verity et al. supposedly over-estimated the fatality rate for SARS-CoV-2-induced COVID-19, based on Lewis’ analysis of data from the Diamond Princess. Five months later, it’s clear Lewis was wrong and Ferguson et al. were right. Maybe someone ought to write something about that, as the climate contrarians or “climateers’ try to brush their false predictions under the rug (a courtesy they don’t extend to climate scientists when the climateers think those scientists made false claims)…
Thanks to Joshua for pointing this out, even though the usual Climate Etc. denizens didn’t bother to pay attention. It’s problematic when Lewis’ analysis hinges on 8 people dying, when 13 people (and eventually 14 people) actually died:
Joshua:
“Time for another update – deaths up to 13”
Nic Lewis:
“Here, I adopt the same death rate model and use the same data set, but brought up to date. By 21 March the number of deaths had barely changed, increasing from 7 to 8. Of those 8 deaths, 3 are reported to have been in their 70s and 4 in their 80s. I allocate the remaining, unknown age, person pro rata between those two age groups. As at 21 March the Verity et al. model estimates that 96% of the eventual deaths should have occurred, so we can scale up to 100%, giving an estimated ultimate death toll of 8.34, allocated as to 3.58 to the 70-79 age group and 4.77 to the 80+ age group.
Accordingly, the Verity et al central estimate for the Diamond Princess death toll, of 12.5 eventual deaths, is 50% too high. This necessarily means that the estimates of tCFR and sCFR they derived from it are too high by the same proportion.”
Observed seroprevalence-based IFR, including taking age-stratification into account, better matching what Ferguson et al. predicted, as opposed to what Lewis predicted:
https://www.medrxiv.org/content/10.1101/2020.07.23.20160895v3
https://www.medrxiv.org/content/10.1101/2020.08.12.20173690v2 [see supplementary table S2(a)]
https://doi.org/10.1016/S2468-2667(20)30135-3
https://www.medrxiv.org/content/10.1101/2020.05.03.20089854v4
Nic Lewis:
” The Stockholm infection fatality rate appears to be approximately 0.4%,[20] considerably lower than per the Verity et al.[21] estimates used in Ferguson20″
Stockholm, Sweden:
“Our point estimate of the infection fatality rate is 0.6%, with a 95% confidence interval of 0.4–1.1%.”
https://www.folkhalsomyndigheten.se/publicerat-material/publikationsarkiv/t/the-infection-fatality-rate-of-covid-19-in-stockholm-technical-report/
Stockholm, Sweden:
“The infection fatality ratio extrapolates to 0.61% (peak: 1.34%).“
https://www.medrxiv.org/content/10.1101/2020.06.30.20143487v2.full
I wrote this above in August:
“Relative to nearby countries like Denmark, Norway, and Finland, Sweden pursued a less restrictive policy that allowed for a greater rate of community-wide SARS-CoV-2 infections. That increased the chance that elderly people who went out would get infected, as would care facility staff who went to purchase groceries, etc. Those facility staff would then bring the infection into the facility, infecting the elderly people there. So when one allows for more community-wide infection, one increases the risk to those residing within care facilities in said community.
Lewis either does not recognize this, or he willfully avoids it, even though epidemiologists emphasized it for months. He doesn’t draw the connection between the lax strategy he defends (a strategy he admits allows for more community-wide infection) and the increased nursing home infections + COVID deaths that result from said lax strategy.”
A coronavirus commission appointed by Sweden’s government reached much the same conclusion. Sweden’s government also recently took stronger steps to limit community-wide infection, shifting from their older lax strategy that Lewis defended:
“The Commission’s overarching assessment can be simply summed up as follows: apart from the general spread of the virus in society, the factor that has had the greatest impact on the number of cases of illness and deaths from COVID-19 in Swedish residential care is structural shortcomings that have been well-known for a long time.”
Click to access summary.pdf
“The report states that the main factor in the problems in residential homes for the elderly was simply the fact the virus spread so widely in society.”
https://www.thelocal.se/20201215/what-does-the-first-report-from-swedens-coronavirus-commission-tell-us
English translation:
“The strategy to protect the elderly has failed”, writes the Corona Commission. And thus rejects the whole of Sweden’s strategy.”
https://web.archive.org/web/20201216001418/https://www.dn.se/ledare/en-hard-dom-over-den-svenska-coronastrategin/
“Sweden on Monday announced a ban on public events of more than eight people at a press conference where ministers urged the population to “do the right thing”.
[…]
The new limit is part of the Public Order Act and therefore is a law, not a recommendation like many of Sweden’s coronavirus measures. People who violate the ban by organising larger events could face fines or even imprisonment of up to six months.”
https://swedishchamber.nl/news/sweden-bans-public-events-of-more-than-eight-people/
“Sweden’s upper secondary schools are again closing their doors to students from Monday until after Christmas.
[…]
They said it was “necessary” in order to curb a resurgence of the coronavirus across Sweden.”
https://www.thelocal.se/20201203/swedens-schools-for-over-16s-shift-back-to-remote-learning
This is the opposite of what Nic Lewis wanted and expected to happen. He assumed that those criticizing Sweden’s earlier lax policy (a policy Lewis defends) would need to admit they were wrong. Instead, it’s Sweden that’s now backing away from that lax policy since that strategy killed too many people, and are instead heading in a direction Lewis might call “authoritarian”.
Lewis’ words:
“it’s good to see that some politicians have a decent understanding of these important issues, and terrifying to see how poor the understanding of them is by supposed scientific experts who control or influence polic [sic] policy, and how unwilling such ‘experts’ are to change their views as the evidence against them builds.”
Further criticism of Lewis’ false claims in the comments page below:
I’d like Nic Lewis to admit he was wrong and apologize. Plenty of people online peddled his false, non-expert analyses, misleading a large number of people in order to support a lax, lethal, right-wing, politically-motivated response to COVID-19. The least he could do now is own up to being wrong, as he expects others to, especially when he was busy mocking those who corrected him:
“A 5 week delay from positive test to ICU admissions? In your dreams, Josh. You seem to believe everything that supports your – I presume authoritarian – beliefs.”
“You’ve made multiple confused, invalid comparisons. I’m not going to waste my time demolishing them.”
Pingback: 2020: A year in review | …and Then There's Physics