
Zeke Hausfather and colleagues recently wrote a Nature comment with suggestions about how to deal with what is called the ‘hot model’ problem. The issue is that some of the latest group of climate models have somewhat higher than expected climate sensitivities. To account for this, in the latest IPCC report the models were weighted to give more weight to those that better represented historical temperature observations.
This weighting reduced the range of projected warming for the various scenarios and reduced the likely climate sensitivity ranges. Additionally, in previous IPCC reports what has often been presented is what will happen in 2100 along different possible emission scenarios. However, if there are some potentially anomalous “hot models”, then the range of warming in 2100 for each scenario would be quite broad and the possible 2100 climate could vary quite widely for a given scenario.
To account for this, what the recent IPCC report did was to use Global Warming Levels (GWLs) rather than presenting the output at 2100 for each set of scenarios. In other words, rather than reporting how the climate will change in 2100 for each scenario set, they highlighted the changes that will probably occur if we were to warm by 1.5oC, 2oC, 3oC and 4oC. The advantage of this is that you can use all the models and may not need to weight them; even a “hot model” may give a reasonable representation of the climate in a, for example, 2oC world, even if it gets there sooner and for a lower level of cumulative emissions.
However a lot of the current research that assesses the impact of climate change still use the scenarios, rather than using GWLs, and doesn’t account for the possibility that some models are “too hot”. The Hausfather et al. article was basically suggesting that researchers who use climate model output to assess the impact of climate change should aim to follow a similar practice to what was presented in the most recent IPCC report. Use GWLs, rather than simply focussing on scenarios going to 2100, weight the models if the warming trajectory is relevant, and try to consider which models may be best suited to the problem that is being considered.
The reason I thought I would write about this is partly that it’s interesting and I haven’t had much to write about recently, and partly because Mike Hulme wrote a critical response. In the original article, the authors claim that “despite some differences related to the rate of warming and aerosol forcing, the world largely looks the same at 2 °C, no matter how we get there.” Mike Hulme’s response suggests that “[a]gainst criteria that matter, not all future 2 °C worlds would be the same — even though the climate might be.“
Of course, Mike Hulme is correct that there isn’t a single 2oC world. It will depend on the various socio-economic factors that Mike Hulme mentions in his response. However, I’m pretty sure that the authors of the article were not implying otherwise, even if it is unfortunate that they chose to say “the world looks largely the same“. Given that the context was the output from climate models, I’m pretty sure that what they meant was that the world’s climate will look largely the same, which even Mike Hulme acknowledges in his response.
I find this kind of thing rather frustrating, especially as the original article was addressing a problem and making constructive suggestions about how to use climate model outputs to assess the impact of climate change. The point of the article was not to convince people that the future world will depend only on the level of global warming. The article was presenting a set of suggestions for how those who assess what the world might look like should use the output from climate models. In a sense, the article was trying to help researchers do the very thing that Mike Hulme’s criticism seems to imply that the authors don’t understand.

Did Hulme give a suggestion of a better approach (I can’t access the paper at home)?
I ask as he didn’t have a better approach to the problem of “anti-consensus messaging” than “consensus messaging” (i.e. reporting the scientific facts about the consensus).
I suspect the climate skeptic blogs are full of stories about how climate scientists are discussing the *problem* of models running hot and downweighting them! ;o)
No, he wasn’t suggesting some alternative. He was simply criticising the suggestion that the world would look largely the same, irrespective of the pathway. I don’t think he really got what the original article was actually highlighting. It may have been better if they had been clearer that they meant the “climate” rather than the “world” but it seems clear that they didn’t mean that all aspects were independent of the pathway.
When interpreting what someone else has said or written, I *try* to interpret it in the way that makes most sense (in the hope they do the same for me). Given that models don’t model society, just the climate, it seems fairly obvious to me that was what was meant.
The “debate” needs more people like Zeke.
would this all effectively resolve if Hausfather et al clarified and polished their position a bit and changed the word world to climate? has that group responded to Hulme?
small,
I haven’t seen a response. I suspect it would clarify things if they did.
It’s not really a paper dikran, just a couple of short paragraphs. The meat of it is:
Of course nobody worth taking seriously thinks for a moment that the first is a viable scenario (at least in that time-frame) outside of Hollywood movies, so that’s a bit of a straw man. More of a Hail Mary pass if decarbonisation fails. And absent an aerosol or other albedo change, 2°C means about the same CO2 and the same ocean acidification regardless of the route, assuming a monotonic increase.
2°C in 2050 but 3-4°C in 2050-2070, with massive clear-air capture after that, is not the same as monotonic to 2°C, because there will have been irreversible loss of and damage to things like reefs around the peak, and there will be a deep reservoir of CO2-rich water lurking in the oceans and waiting to come back and bite us. And 30 years adaptation time vs. 80 years adaptation time is a huge difference. Pathways that let the West keep their Chelsea Tractors, but freeze developing-world emissions, have a huge equity deficit vs. pathways that see the West decarbonise while subsidising developing-world decarbonisation.
So he has a point, but has chosen some odd examples.
Dave,
Indeed, but the other issue was that the context of the Hausfather et al. article was how to use the output of CMIP6 models, none of which consider scenarios that include SRM. Maybe they could have made that clearer, but it wasn’t all that hard to work out.
I have a different complaint about Hausfather et. al than Hulme. No complaints with the logic of ditching the year 2100 scenario comparisons. As we have discussed previously the scenarios already diverge from reality and are unlikely to provide good information on the world of 2100.
My complaint concerns the model boundary conditions, which will become increasingly inaccurate as warming proceeds. Ice sheets for example will dump increasing amounts of melt water that isn’t accounted for in climate models. No way that 4C is as accurate as 1.5C and the models are underestimating the differences.
I can’t understand why no-one is prepared to follow Feynman and state that some models are simply wrong and should therefore be discarded. It makes no sense to continue model “democracy” over such an important issue. At the very least those “Hot models” should be recalibrated so as to agree with data. Thus we read:
“Numerous studies have found that these high-sensitivity models do a poor job of reproducing historical temperatures over time4–7 and in simulating the climates of the distant past8. Specifically, they often show no warming over the twentieth century and then a sharp warming spike in the past few decades3, and some simulate the last ice age as being much colder than palaeoclimate evidence indicates”
In layman’s language : These high sensitivity models are wrong !
“I can’t understand why no-one is prepared to follow Feynman and state that some models are simply wrong and should therefore be discarded. ”
I trump your Feynman with GEP Box.
Doing a “poor job” is not the same thing as “simply wrong”. The problem is we only have one realisation of internal climate variability for the observations and the purpose of the models is to determine our best estimate of the plausible outcomes of the *distribution* of effects of internal climate variability, given what we know about the physics. Downweighting sounds a more reasonable approach than deletion.
Clive,
I suspect part of the reason is simply a concern that maybe these “hot” models are representing some aspect of the climate that the other models are missing. However, my understanding is that the latest IPCC report did get rid of model democracy and did weight the models according to how well they represented historical warming and the Hausfather et al. article is essentially suggesting that researchers who study the impact of climate change should do something similar to what was done in the IPCC reports.
Chubbs,
Yes, I suspect the models are going to be missing processes that could be important, but I think the point of the Hausfather article was mostly suggesting what researchers should do with existing models, rather than how existing models could be improved.
Clive, I trump your Feynman with Asimov, on The Relativity of Wrong.
I don’t think Feynman actually said that “your [beautiful] theory is simply wrong and should therefore be discarded ” If he had it would have shown considerable ignorance of scientific method. We generally don’t discard theories because they don’t agree with experimental results. We first check the experimental results (it is possible to get experiments wrong and the results don’t always mean what we think they mean). Generally we refine or modify our theories to account for the experimental results/observations. In programming this is known as Compiler Error Driven Development (I don’t know if Matt Godbolt invented that, but it was him that I stole it from ;o).
Part of being a good scientist is to manage the tension between self-confidence and self-skepticism so you know when to stick yo your guns and when to call it a day and work on something else. Sadly the climate debate has more than it’s fair share of people that are not managing that trade-off. Zeke is certainly not one of them IMHO!
Brilliant as Feynman was, not everything he said was true.
I was beaten to it on Box and Asimov. And can’t be bothered checking what Feynman said, because in my experience sweeping statements allegedly said by some authority-figure generally turn out on investigation to be snarks or boojums.
But no Clive, the high-ECS models are not “simply wrong”. Several of them overlap within error bars, as was shown in a previous thread covering a paper which had perpetrated a falsehood in that regard, so it is not even clear that those ones are even wrong (assuming the consensus ones to be right). Per Asimov, the others are not simply wrong either: they may be inaccurate, but compared to, say, ECS = 0 because clouds, or ECS might be negative, they are in spherical Earth vs. oblate Earth territory, as opposed to flat Earth vs. oblate Earth territory. Negative ECS, disagrees with a host of other geological, physical and planetological observations; the “warm” CMIP6 models do not. For starters we couldn’t have had Ice Ages. A qualitative not just quantitative difference. And ECS = 0 requires a degree of fine-tuning which is implausible without Divine Intervention, so belongs in the realm of religion, not science. And of course there are those pesky Ice Ages…
> It makes no sense to continue model “democracy”
It actually does, Clive. Fund managers have no access to crystal balls. So they’ll try not to predict market trends too much and prepare for the worse by allocating with prudence. They might overweight what works and rotate stocks that underperform, but they’ll always try to make sure to get returns everywhere they might be without compromising too much on risk. On what grounds should we think that the historical run ought to be representative of what should always happen, BTW?
Oh, and assigning different weights to votes isn’t exactly how democracy works.
A science historian should do an analysis on how Box applied his infamous quote over scores of papers he wrote. It seems like he applied it to whatever context served his purpose. For example, in this quote, he applied it to a trivial numerical approximation model

Hard to believe anyone would find fault with this kind of model — using a polynomial as an approximation to represent enough accuracy and/or precision to the more detailed model. “All spline models are wrong but some are useful” doesn’t have the same kick, eh?
I quite likely bumped into this👇Feynman anecdote¹ about experiment/observations vs hypothesis/model right here in the comments section of this blog.
In any event, here’s Feynman personally encouraging a physicist whose theoretical work on solar neutrinos initially appeared to have been rejected by the experimental evidence (but whose theoretical model was ultimately vindicated):
There are, of course, famous anecdotes/clips of Feynman also arguing for rejection of the model in favour of the evidence. So, I don’t think we can just say “But, Feynman!” – in the present CMIP6/High ECS vs observations case, or otherwise.
If anything, it argues for a much more nuanced provisional approach, including the application of expert assessment.
¹ Hunting Solar Neutrinos: Astrophysicist John Bahcall recalls what it felt like to solve one of the great mysteries of particle physics
Taylor and Maclaurin series are polynomial approximations, GEP Box was indeed right they are sometimes useful. I have seen people question why linear trends are useful in understanding non-linear processes. Well a first order Taylor series approximation is a linear model. If the thing you are trying to understand is close to a straight line, then a first order Taylor series approximation is likely to be reasonable. You have just estimated the first derivative of the non-linear function numerically ;o)
“If anything, it argues for a much more nuanced provisional approach” – perfect for social media and blogs! ;o)
Thanks for the other Feynman quote, I’ll have to remember that one as well.
I agree with the Asimov quote. But refining basic physics such as the laws of gravity by Einstein or the spin of the electron by Quantum Electrodynamics were fundamental predictions later confirmed by experiment.
Climate science is different. It is more like thermodynamics. The big picture is clear while the details are messy and uncertain. The rule should be first the ability of a model to describe the seasons with latitude/longitude and altitude, diurnal temperatures, glacial cycles etc. Only then can we begin to believe long term predictions.
Just to be precise, the quote above is technically John Bahcall’s personal recollection of what Feynman said directly to him on their walk (i.e., a second-hand quote). But the historicty of the background and just-prior presentation to Feynman, Murray Gell-Mann and others, and other confirming representations I have found, suggests that he accurately captured what Feynman actually said and thought at the time.
Yes the Solar neutrinos problem turned out to be a great discovery ! Neutrinos have mass and can oscillate between muon and electron neutrinos.
“The rule should be first the ability of a model to describe the seasons with latitude/longitude and altitude, diurnal temperatures, glacial cycles etc. Only then can we begin to believe long term predictions.”
To what level of accuracy, over what timescale? Those who don’t want to believe long term predictions will always be able to specify greater accuracy or a longer timescale of prediction. Also (as I think we have established) believing isn’t binary, it is a matter of degree.
At the end of the day, the reason to trust long term predictions is understanding of the physics. It is easier to trust a model if you understand at least the basic principles. For GCMs most people don’t have a clue, and I wouldn’t regard myself as being a long way further along the road than that (I know enough about it to know what a real expert looks like).
I’ve been thinking about this a bit because of the new Koutsoyiannis et al paper (doi:10.1098/rspa.2021.0836). It has some interesting bits about how we identify causal relationships. For me it is association, temporal sequence and having an understanding of why, not just a rule that dictates what. That isn’t that much easier to identify, but it is a rule that explains lots of other things, not just the system I am studying. It is that understanding that makes me trust a model rather than “it works”.
The basic physics is pretty clear. More CO2 increases the greenhouse effect leading to moderate warming. The complexity (and uncertainty) arises when you try to model everything else as well .
Clive, indeed, we don’t need GCMs to tell us that if we emit carbon dioxide into the atmosphere then global mean surface temperatures will rise as a result and we know broadly by how much without needing GCMs. However there are plenty out there who nevertheless claim that climate models (GCMs) can’t predict global mean surface temperatures, when evidently they can. If someone doesn’t trust models they don’t understand, there may not be a level of accuracy that would satisfy them. Whether that is a bug or a feature…
1.4C is a somewhat nuanced “moderate warming” ;o) Does that reflect the all uncertainties involved?
The thing about Taylor series is that they are exact representations of a sinusoidal wave, given enough terms are included, so I don’t know how one can consider that one fundamentally “wrong” as Box was trying to suggest. In that case all the numerical computational libraries are wrong and we can toss our hand-held calculators.
Here is Box, applying his quote in another context:
Sorry, it’s a pet peeve off mine to see the Box quote used as a dismissive.
“see the Box quote used as a dismissive.”
I’ve never seen it used as a dismissive (or more accurately if it has been used as a dismissive, I haven’t picked up on the subtext).
“The thing about Taylor series is that they are exact representations of a sinusoidal wave, given enough terms are included”
It requires an infinite number of terms to be an exact representation, so you can never exactly evaluate a sine that way. In practice (unless you are using it algebraically), it is necessarily an approximation.
That explains why I never use the Box quote. Another one often used as a dismissive is “if you torture the data long enough, it will confess” . That’s actually a misquote of this:

Which I quite like and try to abide by, i.e. persistence.
this https://imagizer.imageshack.com/img921/4590/sJmLUd.png
Paul, the most important part of that Box quote is the bit you didn’t highlight:
In-sample vs. out-of-sample. Obviously even in-sample you can still do silly things, like fit an exact, wiggly spline where the right thing to do is assume some measurement or other uncertainty and fit a relaxed spline or a polynomial.
For out-of-sample, as in forward modelling climate change, well, Then There’s Physics 😉 .
“For out-of-sample, as in forward modelling climate change, well, Then There’s Physics”
or if you are going to use statistical models, an estimate of the predictive uncertainty from all known sources. It is possible to construct statistical models that can tell you when you have extrapolated too far from the calibration data for the prediction to be useful. Bayesian methods can be particularly useful for that.
Clive:
Irony Meter. Broken.
Better practise your poker face before the next game. Such an obvious Tell will lose you your shirt.
And please, not the Uncertainty Monster. We’ll take that seriously when you come here demanding that ECS range up to 6.5°C. Come to think of it, consistency demands that on that basis you demand that the IPCC not downweight those “hot models”, but that they all be given equal weighting. RCP8.5 too, for good measure.
But then consistency would also demand being unselective about a lot of other things, so I’m not holding my breath.
Skeptics love to complain about models, an easy bogeyman in their mind perhaps. However, as pointed out in the first para of the blog: “the more representative models are given higher weight”., i.e, observations are driving the IPCC ar6 warming estimates. That’s the point of the Hausfather paper, How to use the models without accepting their warming estimates.
Agreed dikran, but in a system with tipping points you’ll still be bitten.
Non-climate example: a stress-strain curve on a core plug before fracture will tell you nothing about the unconfined compressive strength, where it fractures*. You’ll probably see a rapid increase in strain rate just before fracture, but that’s so close to fracture you’ll likely fracture before you notice the change. Once you’ve done it once you might drastically reduce the strain rate at that point, because the shape of the curve may help you understand the pre-fracture physics.
* There’s actually a pretty good rule-of-thumb relationship between Young’s Modulus and UCS for a given material, and not only that, it’s linear, but don’t try applying a sandstone function to limestone, steel or concrete. And as for synthetic rubber… Actually that methodology is doubly out-of-sample. There are non-linearities as you compact and stabilise the sample and the equipment, and as you approach failure. Before the final catastrophic failure it follows a sort of logistic curve, and good luck telling where it will go bang from the decreasing curvature. You use the linear, central bit. Ideally, if you want to re-use the plug for something else (which is why you stop before the UCS), you stop as soon as it goes non-linear because after that you’re doing inelastic damage and it’s no longer the same sample.
Actually the paper I took that from is a bit of an oddball. We wouldn’t touch cuboidal plugs with a barge-pole (although in fairness it is an ISRM-accepted method). And conical failure? Never seen that. Axial splitting, of course, means a rejected sample. So I think they’re doing a bit of uncertainty-monstering themselves, by including samples that most labs would reject. Which takes us back to rejecting some CMIP6 models, but for known physical reasons, not just because they “don’t fit”.
Oh, and the guy in Fig. 4 should be wearing wrap-around safety googles. The most likely scenario where they do you any good is a leak of pressurised hydraulic fluid, and as an all-day spectacle-wearer I can assure you that droplets have an uncanny knack of swirling round behind the lenses, even in rain with just a slight wind.
I think the thing I find odd is that we are clearly perturbing a complex, non-linear system, and could introduce a perturbation of > 10% (i.e., >3C on top of a natural greenhouse effect of ~33C). So, why would we expect the response to be small and linear? It might be, but complex, non-linear system are capable of doing surprising things when given a relatively large perturbation.
Dave: I (too) often say the reliability hierarchy is:
physics > statistics >= chimps pulling numbers from a bucket
and I am a statistician (of sorts). I am much more convinced by physics than I am by statistics.
“and as an all-day spectacle-wearer I can assure you that droplets have an uncanny knack of swirling round behind the lenses, even in rain with just a slight wind.”
as a spectacle-wearing cricketer (of sorts) I can confirm that! ;o)
I should add, the fun part of statistics is learning enough about the science that you can make a model that includes what you know about the physics of the system. Making physics free purely statistical models isn’t generally very interesting and is likely to lead you astray without you realising it. Examples of that abound. If you build in the physics in your statistical model, you may catch the tipping points as well.
Indeed dikran, “know the physics”.
Given only the logistic curves above, we couldn’t tell whether flattening is a precursor to brittle failure, or whether it is an elastic-plastic material and once it flattens it will just keep on deforming at constant stress.
However if we looked at a sample (ideally, multiple samples progressively further into the flattening) and saw increasing numbers of microfractures, we’d expect brittle failure at some point. But if we saw the appearance of subgrains with no fracturing we’d expect ultimate plastic behaviour, once all the original large grains have been converted to equal-sized subgrains.
Of course there may be other relevant information: for example, I’d expect brittle failure at the P,T conditions of my industry career, and ductile behaviour at the P,T conditions of my PhD rocks.
On the safety front, the reason goggles only help with hydraulic fluid is that anything bigger won’t be stopped by goggles. The kit we use in the oil industry usually goes up to about 30,000 psi. Manchester University used to have a rig (still does, I presume) that went above 100,000 psi and 800°C. But it lived in a concrete bunker and was operated remotely. Not without reason, the HPHT community calls their sample chambers “bombs”.
The kit usually has a perspex screen so you can see what’s happening, but I doubt if that would stop the worst-case failure, which is a misaligned sample or pistons resulting in a lump of metal shooting out sideways as the pistons or driver buckle. I’ve seen the aftermath of that with the press I used to make XRF powder pellets for my PhD, and that was only about 10,000 psi (I wasn’t operating it, but a flatmate was). Walls painted in hydraulic oil, nuts and bolts embedded in the walls and ceiling, and a hole in a plasterboard wall where the 1kg sample-holder had exited into the next room. Miraculously, the operator was unharmed (if you stand in the right place there’s a lot of metal between you and the action, but of course then you can’t look through the window). Nowadays, of course, it’s all computer-operated and you can disappear for a cup of tea or lunch.
In terms of computational models, an example of an obviously wrong model is the Pentium FDIV bug of 1994. At the time, that got everyone in a full-blown tizzy as if the end of the world was approaching. Yet, all the other computational models are considered right, even though they are fundamentally wrong since floating-point computation on its own is an approximation. So why doesn’t Box’s quote “all models are approximations” get prepended to the infamous quote ?
All models are approximations => All models are wrong
I think because it exposes how inane the assertion is, and that Box was being a touch sarcastic.
No, I don’t think that Box is being at all sarcastic – that doesn’t fit with the wider context. He is emphatically saying that approximations, while the are wrong in absolute terms, serve a purpose.
Floating point arithmetic is an excellent example of a useful approximation (when implemented correctly). However, the programmer needs to understand the limitations of the approximation in order to avoid trouble. There is an excellent paper by Goldberg on the subject “What every computer scientist should know about floating-point arithmetic”. It isn’t at all difficult to expose the flaws in floating point arithmetic, one of the early lab exercises on my first year programming course includes some exercises to help students learn about them.
“So why doesn’t Box’s quote “all models are approximations” get prepended to the infamous quote ?”
Because that is precisely the point he is making – to spell it out explicitly would reduce the impact of the pithy maxim.
… and also they are useful precisely because they are approximations – almost always simplifications of reality that we can actually understand.
@WHUT you keep saying “fundamentally wrong” [emphasis mine], but that is fundamentally not what Box said.
Yes, clearly Box meant “wrong” as in “not perfect representations of reality”, part of which is because of numerical issues, and part if because of approximations. So, I think what he said is pretty clear, models are useful, but they’re never going to be completely right (or, perfectly represent the system being studied).
Exactly!
[Dikran Marsupial]
Not quite as pithy though ;o)
Agree that I’d rather see this get traction “all models are trivially wrong, the ones that aren’t fundamentally wrong may be useful.” One can fit category theory in the latter — it may eventually find a use.
Hume, et al, are as usual kquibbling. raising unreal objections to physical facts.
The idea that society will respond differently to a GMT of 2C if it happens in 30, 50, or 80 years is spurious. Human society will react to changes in agricultural production that is dependent on climate. Society shows very little ability to respond to future threats, most efforts to do so have been ;greenwashing; so far.
PoMo ideology is inherently tied into bio-determinism and the defence of the status quo whatever it may claim.
Category theory models are provably correct, some may prove useful. Consider that data-flow diagramming a la Matlab’s Stateflow is a retroactive application of category theory. Baez tweeted on how its being applied to pandemic modeling
https://twitter.com/johncarlosbaez/status/1448281194559332356
The models themselves may still be wrong but the construction of these models may be improved via CT.
Regarding the Feynman vs Box advice, here is Box perhaps suggesting that if all models are wrong, better make them as simple as possible”
And in the latter bit, are “hot models” considered the tigers or the mice?
Just about spot on !
attp says “why would we expect the response to be small and linear? It might be, but complex, non-linear system are capable of doing surprising things when given a relatively perturbation”
I sometimes attempt to make that point or something I think is similar. It crosses my mind that if the system started doing “surprising things” that relate directly to global heat buildup, then the time when we would probably first spot a surprising thing kicking off would be during an El Nino episode where global temps spike enough to kick something off. Some folks here were quite insistent that an El Nino event was not something to worry about the last time I mentioned that idea. For me, I think it makes sense to calm down and not start worrying about things like surprising things arising from complex, non-linear systems. The discussion proceeds with less drama if we stick with simple, more linear extrapolations and try to imagine what the planet will look like at 2100 given simple linear projections. Overall, that approach tends to get a warmer reception.
Attp: can you say more about the range/nature/quality of surprises that you are thinking about?
Cheers
Mike
“Attp: can you say more about the range/nature/quality of surprises that you are thinking about? ”
While I’m not ATTP, surprises, by their nature, are likely to involve “unknown unknowns”?
“but complex, non-linear system are capable of doing surprising things when given a relatively perturbation”
If that were really true then we would not even be here to discuss such a hypothesis because life on Earth started 4 billion years ago and has survived far worse than our current impact.
There have been plenty of mass extinctions over the last 4 billion years, and most of them involved disruption to the climate.
Clive,
So, you’re interpreting “surprising” as “extinction of all life”? That’s just bizarre.
I was objecting to using the term “non-linear” to describe our impact on the climate.
Supernovae, Meteor impacts, Earthquakes and Massive volcanic eruptions are non-linear. Doubling CO2 un the atmosphere isn’t.
Clive,
I did not say “our impact” was non-linear, I said the system is non-linear.
> If all models are wrong, better make them as simple as possible
The simplest model to evaluate climate modulz is to prefer none and to take them all equally. This would be simpler than, say, to root for EBMs just because they’re basically napkin accounting exercises.
Sometimes I really wonder if contrarians ever played Poker.
Luckily for us the system is mostly linear.
General Relativity is linear
Quantum Mechanics is linear
I agree that Sh*t can happen though.
Clive,
Yes, I know the response is probably going to be mostly linear, but if the perturbation gets large enough (which it could), then it might no longer respond linearly and there may well be surprises in store (which is essentially what I said initially, which you’d have realised if you’d bothered to read it properly).
Willard.
I wonder sometimes what you imagine a contrarian actually is ?
For sure we have lots of problem but climate change is just a symptom not a solution, because we can wait 10 years until nuclear fusion is solved.
Our greatest danger is from XR Nihilists chanting slogans.
Clive,
😂
Plus, this is also bizarre
Greatest danger? Seriously?
Simply avoid so-called hot models:
So by a direct measurement, the actual transient climate response is 2.4 K for doubled CO2.
Oh dear, no, General relativity is certainly not linear:
https://en.wikipedia.org/wiki/Friedmann–Lemaître–Robertson–Walker_metric
Not that this had much to do with Terran climate.
David,
That’s a nice post by Tamino. However, we actually don’t have a precise estimate for the change in forcing since pre-industrial times. There are short-lived GHG and aerosols that complicate the estimate. Also, I think what Tamino is approximating is the TCR, rather than the ECS, in which case 2.4C seems a bit high.
Clive said:
Navier-Stokes responses are non-linear and for geophysical fluid dynamics, that’s all that matters, for better or worse. On the negative side, that means that all the efforts to impose a linear solution are pointless as there are infinitely more non-linear solutions possible than linear. On the positive side, there are methods to determine non-linear response curves, including machine learning and other approaches. I think that’s a rationale for the big push for ML studies of climate variability in that it’s one way to traverse through the search space to root out the salient physical processes at work.
aTTP: Tamino starts in 1880 CE, which provides over 140 years of good CO2 data along with a good-enough global temperature product. Indeed, ads mentioned in the comments there, CO2 only accounts for about 83% of the total forcing from all the short-lived heat-trapping gases. but it doesn’t matter as the correlational fit is so suburb!
Indeed, as I stated, what is obtained is the Actual TCR for all the short-lived heat-trapping gases as measured by atmospheric CO2 alone. Indeed, it is 2.4 K for doubled CO2 concentration. This is a clear, accurate means of projecting future heating as these concentrations continue to increase.
It is the Actual TCR, not the climate model TCR as the latter assumes 1% growth in concentrations whereas the actual growth is more like 0.56% currently.
This value might seem as bit high, but fits right into the range given in the paper cited and linked in
https://bravenewclimate.proboards.com/thread/748/climatology-background?page=1&scrollTo=8353
which assesses all the lines of evidence for ECS to date.
David,
I still think that’s not quite right. The warming we’ve experienced has been a response to all of the emissions that produce a change in forcing. The TCR is defined as being the response to a change in forcing equivalent to a doubling of atmospheric CO2 (~3.7 W/m^2). So, if the change in forcing since ~1880 is slightly greater than that due to CO2 alone, then we will have warmed slightly more than if it had been due only to CO2 only, and Tamino’s method will slightly over-estimate the TCR (I still think it’s a good illustration of the strong correlation, though).
Luckily for us the system is mostly linear.
so in other words, it is “non-linear”
because we can wait 10 years until nuclear fusion is solved.
😂 x 10^6
aTTP: The measured correlation with CO2 forcing is 2.4 K for doubled CO2, not the approximately 1–1.2 K since 1880 CE. At the current rate of change of the Keeling curve we reach 2 K of warming in 2080 CE, assuming that CO2 remains 83% οf the total forcing.
If you *really* have some use for the stated definition of the TCR, not the aTCR measured by Tamino, multiplying by 0.83 is good enough: TCR ~ 2 K.
David, in the latest IPCC report, the best estimate for the overall change in forcing since 1750 was about 2.7W/m^2, which is about 0.7 of a doubling, rather than the ~0.6 that I think Tamino was assuming.
aTTP — Tamino is only assuming that
Δt = τ*ln(c/280)
where Δt is the change in global temperature,
τ is the correlation coefficient to be measured,
ln is logarithm base 2, so that ln(2) = 1 describes the doubling,
c is the concentration of atmospheric CO2 in ppm
and 280 is the assumed preindustrial value.
This equation is the standard logarithmic so-called Arrhenius-Wigley rule. For more see
https://bravenewclimate.proboards.com/thread/748/climatology-background
> I wonder sometimes what you imagine a contrarian actually is
Thank you for your loaded question, Clive. Allow Thy Wiki to explain:
https://en.wikipedia.org/wiki/Contrarian
Also note the Matrix for examples of contrarian stances regarding AGW:
For more of the same, cf. clivebest.com.
Sometimes I wonder if you think I did not notice how you are evading the two points I made in my previous comments. The first was that your conception of democracy was a bit “contrarian,” to put it mildly. My second was that your acceptance of simplicity did not cohere with your qualms about higher sensitivity modulz.
Hope this helps.
David,
Yes, I know what he’s doing, but he seems to be using a non-standard definition for the TCR.
Geology primer time Clive:
Supernova mass extinctions: 0.
Meteor impact mass extinctions: 1, although it did come on top of climate change caused by a Large Igneous Province, so maybe the dinosaurs’ ticket was punched anyway. And even then it required a lucky strike on a sulphate-rich substrate.
Earthquake mass extinctions: 0.
LIP mass extinctions: every single one that has been decisively attributed. Mediated, of course, by global cooling caused by aerosols, swiftly followed by global warming caused by GHGs.
Some of the Snowball Earths may have been caused by a reversal of the GHG effect: photosynthetic organisms triggering their own downfall by destroying GHGs.
Sorry Clive, but it’s GHGs and climate all the way down.
Complete and utter twaddle. Logic fail, truth fail, and fact fail.
A sure-fire way to completely destroy any credibility you had left on the matter.
LIPs were a much, much slower burn than anthropogenic emissions, a couple of orders of magnitude slower, and even the PETM, where some combination of a stored-methane tipping point and burning of fossil fuels by North Atlantic sills put the usual process on steroids, was an order of magnitude slower. And of course as far as non-linearity goes, the Earth doesn’t care where the emissions came from: because, well, Then There’s Physics.
Oh, and a humanity primer: the threshold for concern kicks in long before 97% of species go extinct.
Clive obviously doesn’t play poker Willard.
His nonsensical XR contribution was another Tell.
Not sure if I’ve seen someone say this, but models are measured on multiple attributes, of which global temperature response to a doubling of CO2 is only one. One reason why the GWL approach is useful is that it allows us to include those models which do the best job of, for example, representing the geographic pattern and variability dynamics of precipitation, which is key for understanding local impacts. We can use simple models (not Clive simple, but I’m thinking FaIR or MAGICC simple) to estimate future global temperatures, but we can’t use them for geographic patterns or intra-annual variability – we need the big GCMs for that. So we use both!
I do find myself getting frustrated by some of the rhetoric coming from activists, but it’s clearly not even close to being the “greatest danger”. If anything, I’d argue we’d benefit from people engaging more with politics, even if we disagree with what they’re promoting.
Perhaps someone needs to write a version of “Climate Deniers* Are Giving Us Skeptics a Bad Name” (which all skeptics/contrarians would do well to read), but aimed at XR and other extreme activists? There are some arguments they regularly use that will only serve to marginalise themselves from the political debate by losing scientific credibility. I’ve get blocked by more extreme activists on Twitter almost as frequently as by contrarians these days ;o)
But saying this is the ““greatest danger” is absurd, except perhaps in relation to own goal opportunities.
* Singer’s use of the d-word, not mine.
blind people trying to feel and describe the elephant. Everybody knows their opinion is correct because they have their hands on some facts that make a powerful argument in favor of a certain opinion. I think it makes sense to cultivate a tolerance for all who are attempting to describe the elephant in good faith. The questions of tolerance, good faith, working together to come to an understanding and plan of action is a path with heart for me.
I am encouraged a bit when a thinker like ATTP inserts the cautionary ideas about perturbing a non-linear system. I know ATTP posts in good faith. I also know that I spend more minutes of my life worrying about the “surprises” that are going to appear sooner or later. Unknown like Dikran, who I also know posts in good faith, I don’t think most of the surprises are unknowns unknowns. There may be some of those on the horizon, but the knowns are sufficient to power up my worries. I think about “surprises” like a sudden spike of methane from numerous planetary sources driving a temp spike that speeds us in to a blue ocean event. I think about the increase in global temp that is already happening with loss of ice-albedo moderation. But I try not to think about it too much.
It’s funny to me when the folks who post in bad faith take a moment to punch a hippy and assert that the alarmists are a great danger. It’s sad to me when good faith centrists on the science of global warming also lean in and slap the hippies instead of engaging in a polite manner with the good faith alarmists in a civil and sophisticated discussion about our situation.
I remember hearing after Sep 11th that no one had considered that other folks might fly planes into buildings. That, of course, was rhetorical or mistaken or both because security measures had been applied to this possibility before Sep 11th. Never mind the facts, right? Let’s push a meme that serves a certain agenda.
So, it is with the idea of perturbing a non-linear system, in my opinion. To inject that thought is generally a violation of the overton window, but over time… as “surprises” arise and are recorded… the overton window moves. Most of the surprises that we will see/record/experience with global warming will be the known knowns that simply arrive ahead of our schedule.
I am not sure what this has to do with the “hot model” problem. I would guess that most of the hot models are simply constructed in a manner that allows more linkages, tipping points, and feedbacks that constitute a sufficient perturbation to create surprising results. I have thought for years that the time frames for a bulls eye prediction on global warming is probably a certain date, give or take a couple of centuries. Our prediction practice has been most recently set as trying to figure out what happens by 2100, but that is breaking down as we approach or begin to see certain outcomes in the present day that are “not supposed” to happen until later this century. So, the idea of giving up on 2100 as an important moment makes sense. I think imagining/peaking ahead ever so slightly to the state of the planet at 1.5 or 2.0 degrees warming makes sense. The impacts of these warming levels are probably pretty easy to describe, but the conditions that accompany these particular levels are quite variable and dependent on “surprises” that have occurred and the level of human decarbonization that has been accomplished at each particular moment/temp. I think that is Hulme’s point and it may be obvious, but probably bears repeating as a reasonable clarification of Hausfather’s comment. It’s not that simple if Hulme is not a good faith actor. I have no clue on the particulars. But, if that is the case, my default position continues to be that it makes little sense to get in protracted engagement with bad faith actors. Keep it simple and sweet.
I would say don’t poke the bear or don’t perturb the elephant. Decarbonize very quickly to reduce global suffering and impact. I think that makes me a hippy!
what did Lennon say about global warming? Global warming is what happens while we are busy reviewing models. It was something like that.
Cheers
Mike
“unknown like dikran” above should read “unlike dikran”
speaking of surprises and hot models: “Temperature topped 110F on four consecutive days and has not fallen below 80F at night-time for the past week in the Arizona city, breaking several records”
https://www.theguardian.com/us-news/2022/jun/13/phoenix-arizona-heatwave-daytime-night?CMP=GTUS_email
Getting drenched the past few days in the PNW doesn’t look so bad if I look at Phoenix weather. No complaints about the rain from me.
Mike
Clive wrote
“Supernovae, Meteor impacts, Earthquakes and Massive volcanic eruptions are non-linear. Doubling CO2 un the atmosphere isn’t.”
A suggestion that Clive should take a look at paleoclimate before asserting opinion as fact; doubling CO2 has a larger impact on forcing than Milankovich cycles.
I don’t think so. Milankovitch cycles can change the maximum solar forcing at the poles by up to 100 W/m2
Clive: but what is the annual, globally averaged impact of the Milankovitch forcing? After all, that’s all that your simple model cares about. But maybe you want us to consider the feedback of northern latitude snowcover? Well, then why don’t you consider water vapor feedback, cloud feedbacks, and oceanic inertia in your simple model? The nice thing about the consensus approach to climate modeling is that it can handle Milankovitch, CO2, ENSO, aerosols, volcanoes, solar fluctuations, and everything else – because it is complex and physics based. Is it perfect? No, but depending on what question you are trying to answer, there’s an irreducible complexity that you need in order to answer it. (and again, if all you care about is global average annual temperature from a relatively homogenous global forcing, you can get away with a simple model like FaIR, but if you care about more complicated factors, you need the big GCMs).
@Dave_Geologist
You forgot that there has only been oxygen in the atmosphere thanks to cyanobacteria 2.7 million years ago. This was a disaster for anaerobic life but led eventually to respiration and eventually animals 600 million years ago.
As far as I know climate models cannot explain glacial cycles. A full explanation is still missing. The rise and fall of CO2 is due to the waxing and waning of ice sheets . It acts more like a climate feedback to underlying changes on solar radiance.
see here
As I understand it, it is now largely accepted that glacial cycles are triggered by large changes in solar insolation at high northern latitudes. And, yes, in the context of the glacial cycles, the albedo changes and changes in atmospheric CO2 are technically feedbacks, but that doesn’t mean you can’t use these changes to estimate climate sensitivity by treating them as effective changes in forcings.
Clive “A full explanation is still missing.”
again, define “full”, to what level of accuracy/detail?
I did a quick search on Google scholar, which seemed to suggest a fair bit of progress has been made on this.
“The rise and fall of CO2 is due to the waxing and waning of ice sheets . It acts more like a climate feedback to underlying changes on solar radiance.”
Isn’t that the standard explanation (but with ocean solubility also being an factor)?
climatemusings said:
Not ENSO, as there is no consensus as to how to model that. But when a consensus does arrive, it will be a stronger model than any proposed model for glacial cycles (which will never be fully statistically validated).
> A full explanation is still missing.
A full standard model of arithmetic is still missing too, Clive.
Do you have a point?
@-CB
“As far as I know climate models cannot explain glacial cycles. A full explanation is still missing.”
You mean glacial cycles are not part of a linear system where a change in forcing == a change in temperature ?
Shirley you are not suggesting that glacial cycles show a ‘tipping point’ where a change can trigger a much larger non-linear response ?!
re Clive Best:
Day late and a dollar short, but it is very irritating that those denying climate science conclusions and modeling have claimed Feynman as their hero. Those of us who knew him know they couldn’t be more wrong.
As Gavin Schmidt explained, all models are wrong, but some are skillful.
By serendipity, a regular at Roy’s cited the video of a recent presentation by JohnC. Under it there were a few comments by a certain Ralph Ellis, whom both me and Very Tall met a few years back at Judy’s. Reading back the exchange, I stumbled upon this:
Now, I could not care less if Clive is a professor or not. But you know what the Auditor is won’t to say: it’s the little things…
Bait-and-switch duly noted, Clive.
Do try harder.
We need a better class of contrarian to keep us on our toes.
Clive, while it’s undoubtedly true that I’ve forgotten more geology than you ever learned, cyanobacteria do not feature on that list.
I was of course referring to the post-2.5 Ga snowballs, which occurred during times of limited atmospheric oxidation and perhaps limited ocean oxidation. (Of course we have localised euxinia even today; the issue with making global inferences about the deep past is the limited and perhaps unrepresentative sample preservation.) The consensus is moving away from CH4 oxidation though, because as those models you neither know about nor understand have got more skilful, it’s proved possible to model Archean climate under the dim young Sun with CO2 and water feedback alone, without the need for difficult-to-generate high CH4 levels. Other feedbacks involving weathering and biogeochemical cycles are possible however, even in a CO2 greenhouse. But you’d need to accept non-linearity and tipping points to comprehend those.
The timing is suggestive (in the Cryogenian as well as the Palaeoproterozic), with higher oxygen levels after the Snowball, but there is a chicken-and-egg question. Did the escape from a Snowball trigger a cyanobacterial bloom? And even if it did, was a smaller, earlier increase enough, through the action of feedbacks and tipping points, to trigger the Snowball? An interesting feature of many proper, sophisticated models, which incorporate physics, chemistry and biology and don’t just rely on numerology, is that the climate can be bistable or tristable, with multiple possible outcomes for a given insolation. Gould’s contingency may apply to when the Phanerozoic started, and not just to things like tetrapods having four legs because of how many fins their fishy ancestors had.
Disagreement is of course normal in science, as is refinement over time leading to a consensus (did you read Asimov?). As with the consensus over AGW, there will always be a few contrarians – there’s still one professor (and presumably her grad students) who argues (on what looks to me to be shaky evidence) that the K-T extinction predated the Chicxulub impact. At least Keller is a knowledgeable contrarian, unlike the climate variety. That’s the better class of contrarian we need on climate. Not the equivalent of Flat Earthers and Creationists.
Which in the case of the Quaternary glaciations appears to be about as far as the distance from my ankle to the end of my shoelace. Probably a tied shoelace at that.
You’ve got three or four decades of research and modelling to catch up on. Maybe after that you’ll recognise some of your other manifest errors.
Science is All Joined Up, so you can learn lessons for modern climate by modelling past climates, and even exoplanet climates.
Northern Hemisphere solar radiation peaked about 12,000 years ago and has been slowly decreasing since. CO2 currently trumping Milankovitch cycle.
Ooops. left out “summer” in the comment above. Summer solstice radiation at 60N has decreased by 40W/m2 since early Holocene peak. Global average change is minor though.
OT (not entirely though), well deserved award
Izen said:
Shirley has a series of papers suggesting that celestial torques applied to Earth can lead to climate change. Not joking, James H. Shirley is a NASA JPL scientist.
Clive,
Various whataboutery notwithstanding, I think we can say that the ice age cycle comprehensively disproves the notion that the climate always behaves in a linear fashion to perturbations.
Willard,
Classic contraian stuff at Judy’s, that one.
Hmm… Three in-sample observations on a gazillionth of the globe to assess a planet-wide phenomenon. No attempt to see if it works for the other gazillion available samples.
One observation a negative – shades of counting under-predictions as evidence for ESP, due to the subjects’ nervousness, rather than as random noise cancelling out the over-predictions. (E.E “Doc” Smith* deployed the same argument, but in fiction.)
Colour me unimpressed. If it’s a sly nod to “not us, guv”, the contrarian bench is even thinner than I thought. So thin it only has room for two legs. Must be why they keep falling flat on their faces 😉 .
* He did have an actual PhD, in chemical engineering (food science). But presumably considered it not relevant to his SF writing, hence the self-imposed quotes. He certainly didn’t let it get in the way of taking liberties with the laws of physics, although he did have a Campbellian approach of making one big assumption and following science for the rest. So inertialess drives, but when you get to your destination you still have the inertia from your starting location, and have to do a spell of Newton’s Law acceleration or deceleration to match the environment. A bit of a biological cheat too, though – not sure you could safely catch a passenger travelling at kilometres per second in a net, in order to avoid having to match normal-space velocities. Margaret Thatcher also started out as a food chemist – tasked with getting the right yummy texture for ice cream, IIRC. And of course unlike most of today’s right-wing politicians, she saw the perils of AGW and gave a speech to the UN about it.
Of course I am not a Professor, nor would I wish to be one !
I just have a PhD in particle physics but never use the term “Dr”.
Yes the ending of Ice ages is non linear. Here is a model of what I suspect causes it. The deepest glaciations occur when orbital forcing is at a minimum.
Towards an understanding of Ice Ages
Regarding AGW I am not outside the consensus. I understand perfectly well how the CO2 greenhouse effect works on earth.
If everyone agreed with everything written on ATTP website then it would be very boring.
😉
Clive,
In which case your assertion that “Doubling CO2 un the atmosphere isn’t.” [non linear] seems to be just that. Assertion.
“If everyone agreed with everything written on ATTP website then it would be very boring. ”
Personally I don’t find ill-though out criticism interesting, especially when it is presented with confidence and self-evidently incorrect. But that is just me.
Clive, if you’d spent the intervening four years learning about the last three or four decades of research, rather than pursuing numerology, you might just have found out that CLIMBER-2 is not actually a “black box”. That’s a darkness that lies in the ignorance of the beholder, not within the box.
You might even have learned how to spell it correctly.
“We expected to see strong warming, but not on the scale we found,” said Ketil Isaksen, senior researched at the Norwegian Meteorological Institute and who led the work. “We were all surprised. From what we know from all other observation points on the globe, these are the highest warming rates we have observed so far.”
https://www.theguardian.com/environment/2022/jun/15/new-data-reveals-extraordinary-global-heating-in-the-arctic
I don’t want to add to the dangers of global warming by expressing any alarm about this matter. I am not alarmed. I am a little concerned, maybe.
Cheers
Mike
“Personally I don’t find ill-though out criticism interesting, especially when it is presented with confidence and self-evidently incorrect. But that is just me.”
Perhaps you hadn’t noticed but this post was about why some CMIP6 Earth System models were running too hot and what should be done about it. This plot shows just how divergent these CMIP6 models have become as they add more complexity.
PS. I drive an electric car – do you ?
Here is the missing plot.
Perhaps you hadn’t noticed but this post was about why some CMIP6 Earth System models were running too hot and what should be done about it. This plot shows just how divergent these CMIP6 models have become as they add more complexity
Perhaps you hadn’t noticed but this thread was derailed by your unevidenced assertions about linearity of climate response.
PS I cycle 8000km a year rather than drive – do you?
Virtue signalling (TM) – a game for all the family. Passive aggression a bonus.
“Perhaps you hadn’t noticed but this post was about why some CMIP6 Earth System models were running too hot and what should be done about it. ”
Yes, the subject is interesting, but that doesn’t mean that some of the ill-thought out comments below were interesting, e.g.
You later had to row back on the “non-linear”, and the stuff about Supernovae is just hyperbole, there are plenty of non-linear things that are not catastrophic.
Direct answer: No, but only because I have no way of charging it at home, so instead I have a car that does 51 mpg and I don’t do any non-necessary driving.
Commentary: This is the sort of rhetorical BS posing that I find particularly boring. I am mostly interested in the science, I rarely say anything about policy or impacts. So this is just an attempt at “holier than thou” or implying I am a hypocrite and therefore I am wrong about the science. I see loads of this on skeptic blogs and it has always just been a way of avoiding discussion of the science.
Clive,
It’s in the article I link to at the beginning of the post!
ATTP, I presume Clive doesn’t actually read the articles you link to, just as he didn’t actually make the effort to learn about the physics, chemistry and parameterisations in CLIMBER-2, which (assuming his academic background gave him the tools required for comprehension) would have made it no longer a black box to him. Mind you, if you keep your eyes firmly shut I suppose every box looks black!
Clive’s simple model doesn’t include feedbacks. Without water vapor, clouds, and snow/ice, CO2’s impact would be “moderate”.
“It’s in the article I link to at the beginning of the post!”
Which proves I read the article !
There is a basic a assumption of linearity

“Which proves I read the article !”
no, it suggests you didn’t. Why post a plot that we have all seen to make a point (diversity in climate sensitivity) that is the subject of the discussion. Please stop digging.
“There is a basic a assumption of linearity
\Delta{T} = \lambda\Delta{S} ”
what is the purpose of that assumption? Is it a sensible assumption if we are discussing the surprises in climate that you attempted to refute?
This is just more of the ill thought out easily refuted rhetoric I mentioned.
There is a basic a assumption of linearity
\Delta{T} = \lambda\Delta{S}
Quit trolling. It’s not big, and it’s not clever.
I don’t think I expressed that very well. The original point seems to have been “but complex, non-linear system are capable of doing surprising things when given a relatively perturbation”
This is not so much an assumption as an approximation, so this is basically implying something along the lines of “simplified approximations of a complex non-linear systems don’t do surprising things”, which may be true, but doesn’t seem to me to be a logical argument against the original statement. Simplifications are likely to ignore the surprises in order to capture the main structure of the system.
It also only an assumption of linearity in that particular relationship, it doesn’t mean the system is also linear as S may have an implicit dependence on T (which I think was Chubb’s point).
VTG expressed it even better ;o)
Clive,
We know the system isn’t linear. However, there are also strong indications that the response is approximately linear if the perturbation is small. My point was that we could produce a large perturbation, in which case the response may not be linear (or we might be best to not assume that it will be).
Sounds vaguely familiar! ;o)
A sense of deja vue all over again…..
Or maybe it’s just Groundhog Day
https://en.wikipedia.org/wiki/Groundhog_Day_(film)
Here is the basic equation for luckwarm contrarianism:
You are incorrect, Willard. That is not the basic equation for lukewarm-ism. The basic equation is: Given an over/under bet on ECS at 3C, lukewarmers will take the under. That is all there is to ‘lukewarm-ism.’ Thank you for your attention.
Tom,
Indeed, Lukewarmerism is essentially cherry-picking the lower half of the climate sensitivity distribution. I would argue, though, that a fundamental aspect of Lukewarmerism is selecting information so as to justify a view that climate change is unlikely to be so disruptive as to require any particularly urgent action. So, defining it in terms of the evidence cherry-pick misses a pretty fundamental tenet of Lukewarmerism.
Since we’re discussing Lukewarmers, I did have a post about Lukewarmers that had a pretty active comment thread.
ATTP,
I think it’s fair to say that lukewarmerism involves two cherry picks.
1) the lower half of the ECS distribution and
2) the lower half of the damages distribution.
Whether the avoidance of action drives the cherry picks, or the cherry picks drive the avoidance, who knows?
In Tom’s case, you also deny the cherry picks, as we’ve discovered previously.
“Given an over/under bet on ECS at 3C, lukewarmers will take the under.”
As I’ve no doubt I’ve pointed out before, the IPCC are “lukewarmers” by that definition. IIRC the range is 1.5 – 4.5°C and it’s distribution is slightly skewed towards the low end. So if it is an evens bet, then the IPCC would take it as well.
Now if you were going to decide to act as if ECS cannot be above 3C, that would be irrational, the upper “half” of the distribution has not disappeared, unless the impact function decreases with ECS, which is a bit far fetched.
That rather makes the definition of lukewarmer a bit on the meaningless side.
It would be interesting to hear of cases where a Climateball player says “Of course I agree that CO2 emissions have a warming effect, but” without advancing parts and bits of the luckwarm credo.
We should also note that the Luckwarm Church has been anglicanized:
Emphasis added.
We should also note that the Luckwarm Church has been evanlegicalized:
Source: https://friendsofscience.org/assets/files/Spencer-FoS-Reasons-Why-There-Is-No-Climate-Emergency.pdf
Again, my emphasis.
Hi ATTP, well, you might argue that, but I don’t think it’s correct. Certainly some people who self-label as lukewarmers do throw minimization arguments at the wall and hope they will stick, but that’s not a characteristic of lukewarmers in general, nor is it a feature (bug?) of lukewarm-ism as a lens for viewing climate change.
Dikaranmarsupial, you are correct in saying that the IPCC writings fit within the lukewarm spectrum, something I was vilified for pointing out back when I was more active on climate threads.
As for it being meaningless, hey, I didn’t bring it up.
“As for it being meaningless, hey, I didn’t bring it up.”
It’s only your definition that is meaningless, not the term, and you did bring that up.
I notice your didn’t comment on what lukewarmerism meant in terms of policy, which is a large part of why it is meaningless.
Ton Fuller
“Certainly some people who self-label as lukewarmers do throw minimization arguments at the wall and hope they will stick, but that’s not a characteristic of lukewarmers in general…”
An interesting assertion of opinion as fact.
I’ll see your assertion and raise you mine:
“Lukewarmer is a marketing term used to provide a reasonable sounding veneer to opinions otherwise unsupported by evidence”
> Certainly some people who self-label as lukewarmers do throw minimization arguments at the wall and hope they will stick, but
My emphasis. Here’s the same structure in action:
Looks like throwing minimization arguments to me.
(H/T Very Tall.)
AT,
In that lukerwarmer thread I proposed a summary of their credo as
“The earth will not be sterilized therefore all is well.”
Here we have from Clive:
“life on Earth started 4 billion years ago and has survived far worse than our current impact”
Not much has changed.
It seems Clive doesn’t realize that he’s already given away his non-scientific motive for being here:
His incompetent yet persistent attack on teh modulz is informed by his antipathy to strawman “XR Nihilists”, un-mitigated by interest in following climate science where it actually leads. AFAICT, Clive’s “warrant” here is not to correct the scientific consensus, but to wage war on his cultural adversaries.
Dikranmarsupial, I have frequently posted my policy preferences across the climate portion of the blogosphere. Including here. Note that the following are just my preferences–I don’t at all think this is what all other lukewarmers would buy into.
As a short term starter for 10 (understanding that much more will have to be done):
From 2015:
“I’ve said it often enough, but I’ll repeat what I think we should do while waiting for clarity regarding sensitivity and other unresolved issues with the science:
1. Tax CO2 at a starting rate of $12/ton and revisit the rate every 10 years, adjusting the rate to reflect changes in CO2 concentrations and a pre-agreed metric for climate change that has occurred in the interim.
2. Spend a global total of $100 billion for the transfer of technology to the developing world for the purpose of reducing the impact of development technologies, in hopes that they can leapfrog one or two generations of energy development.
3. Commit to spending over the course of this century on moving roads inland, removing permission for construction on threatened coasts and flood plains. The EPA found that this would cost about $400 billion for the United States about 20 years ago–adjust for inflation. But that’s a one-time cost.
4. Continue Steven Chu’s investment strategy for reducing costs in renewable energy, storage and transmission. Continue with ARPA-E at full funding. We may have another Solyndra–probably will, in fact. But we may also have another Tesla, which didn’t technically come from that program, but serves as an inspiration.
5. Encourage the U.S. EPA to regulate CO2 emissions from large emitters.
6. Accelerate permitting for new nuclear power plants to maintain nuclear power’s percentage of electricity at 20% in the U.S.
7. Uprate existing hydroelectric plants to take advantage of advances in turbine technology.
8. Mandate uptake of GPS within the air traffic control infrastructure and controlled and one-step descent on landing.
9. Homogenize permitting and regulation for installation of solar and wind power. Maintain current levels of subsidies and RPS.
10. Increase utilization of Combined Heat and Power facilities from its current 7% of primary energy production to the world average of 9% and then by steps in northern regions to benchmark levels found in Denmark, Holland and other northern European countries.
11. Support introduction of charging stations for electric vehicles.
12. Force existing coal power plants to meet best available technology standards or close.”\
13. Attack black soot with chimney scrubbing and other tech
14. Reforest in accordance with best practices
15. If carbon taxes are adopted, also adopt carbon tariffs to prevent exporting of emissions
Ah. Sounds like proposing things that only deep concern and urgency about global warming can win popular support for in parallel with downplaying concern and urgency about global warming.
Is Tom long or short on urgency futures?
How can Covering Climate Now avoid stranded alienation assets as its Greta demographic matures?
Will Boris ask Vladimir if, from St Petersburg on the Baltic, to Sevastapol on the Black Sea, a carbon curtain has descended across the continent ?
Only COP27 can tell.
Tom, thanks but, as you acknowledge, that isn’t what I asked for. What is asked was what lukewarmerism meant for policy, rather than your personal preferences.
Your definition of “lukewarmer” doesn’t distinguish them from the mainstream scientific position (as exemplified by the IPCC), so it is meaningless unless you can distinguish them some other way.
Your list contains some measures that seem sensible to me (e.g, 1), but there also seem a fair few that are padding, e.g. 8 or would be sensible anyway, e.g. 7 & first part of 9. As for moving roads inland, that’s fine, but the infrastructure serviced by those roads would need moving as well.
Apologies if someone pointed me to this and I’ve forgotten to credit them. I’ve only got round to reading that tab after a digression into dinosaurs and pterosaurs. Which of course are not dinosaurs, nor birds, although interestingly and new-to-me they were super-precocial, like megapode birds, and could fly pretty much straight out of the egg.
Inferring causation from time series in Earth system sciences. Lots of examples to be found in the reference list and citations. If you want to go toe-to-toe with the professionals, Clive, you first have to earn your spurs by learning what the professionals do and why and how they do it.
This one is worth a read too, and with Robert May as second author it must be good. A clever and non-intuitive way (convergent cross mapping) to attribute causation in circumstances of non-separability where Gardner causation doesn’t work. It opens with a warning about mirage correlations in chaotic systems. They’re ecologists but rather neatly use the Lorenz butterfly effect as a toy model to demonstrate the method. Not an ecological model but, per Box, a useful one 😉 . 1500 cites already – see here.
The first paper I linked to points out the strengths and weakness of the various methods, which tend to be that they give no answer or the wrong answer when their underlying assumptions are invalid for a particular set of observations*. So of course you can’t properly apply the method until you understand its strengths and weaknesses. The same goes for the attributes of the data you plan to use. As per some of dikran’s comments about teamwork, a pure stats guy diving into climate, or a climate modeller who has just picked up a script and run an inappropriate method, is liable to make rookie errors. CCR is not a panacea, but is well suited I think to climate because it can tease out causation from correlation in time series, even in dynamic, chaotic systems. Indeed one of the model tests is convergence (stats get better the longer the time series continues). Not just because there is a directional signal as well as oscillations, but because the attractors get filled in even with a time series which is statistically stationary. If it sounds like that should be a given, it’s not. The paper gives examples where “causation” evaporates as the series gets longer. The paper is paywalled, but as it’s in Science the paper is short and the meat is in the supplementary information, which is not.
* Why I used the Mann-Whitney U-Test to compare migmatite and non-migmatite bulk compositions, not the t-Test. The t-Test requires the variances to be the same. I already expected they weren’t, based on previous work that had shown homogenisation on a metre scale in the migmatites. No way was I collecting cubic-metre-sized samples to get round that! Of course I checked that using the F-Test. After first checking for normality.
Thanks for the links Dave, the first paper has some names familiar to me and indicative of good quality (Schölkopf and Spirtes) and may be useful for discussion of a recent paper I have seen demonstrating how not to infer causality from time series. No purely statistical conception of causality is ever going to match our every day understanding of the term, even if we can’t explain quite what it means.
> Gardner causation
You mean Granger, right?
Yes Willard, that was my geophysical background taking control of my fingers (Gardner functions to infer density from sonic velocity – as with UCS from YM, don’t apply a sandstone function to a mudstone; and don’t use it for unconsolidated sediments where there is poor grain-to-grain contact as the sound wave passes*) 😦 .
* You can always apply the Schlumberger “compaction correction”, but that has its own issues as experiments are very difficult to carry out on what is in effect soil, for everything but cohesive mudstones, and for those you have issues with viscoelastic behaviour and the very different loading rate in lab experiments. Another field where just picking up an equation from the Internet can breed rookie errors.
To coin a phrase dikran: ““I know it when I see it“.
Unfortunately human beings are very good at seeing mirage correlations, inferring causation the wrong way round, forgetting to consider whether C causes A and B, seeing who-knows-what in ink-blots or a face on the Moon or Mars, inferring conspiracies when it was an honest mistake, or when the conspiracy theorist finds the truth just too inconvenient, and so forth.
Actually I’ll give myself credit for the first paper as I see I downloaded it in 2019; but a demerit for missing the second paper which means I did not chase down (some of) the source material.
Population ecologists have been dealing with these sort of problems since forever. Robert May’s most famous paper is probably the logistic map one from 1976*, but I encountered it in 1978 in a two-week numerical analysis course I took during my PhD, so it was already well established in the field. The course was taught by a population ecologist – I learned all my numerical analysis and statistics outside of maths departments, because Pure Maths types didn’t sully their hands with that sort of stuff. I also needed two two-week courses in real-world thermodynamics despite nominally having covered that and more as an undergraduate – teaching examples had obviously been chosen for didactic simplicity and met their match in the messy real world. Russell Group universities both times though – it was probably different somewhere like Strathclyde or Robert Gordon’s, which had an engineering-school heritage.
* I see it also shows a mirage periodicity example. In the sense that yes, it is periodic for certain parameters, but there’s no periodic forcing, and no inherent periodicity arising from underlying physical process.
O/T I suppose, but in principle you can make a Gardner function from any log or combination of logs that shows a good correlation. At least in-sample.
Sonic is preferred, because in a linear-elastic material there’s an exact physical equation that gets you density from compressional and shear velocities. Grain density impacts how easily S-waves can wiggle them from side to side. And if you know or expect that you have a constant Poisson’s Ratio, you don’t even need to measure shear velocity.
I should add that there is a physical periodicity in the May (1976) examples, in that the cycles are integer numbers of years, but that is trivial and uninteresting because it’s sampled annually so it can’t be anything else.
The non-trivial and interesting thing is that even for a perfectly repeating annual cycle in the external environment, for certain growth parameters biennial, triennial, etc. cycles can be spontaneously generated, along with non-cyclic and apparently random sequences.
Dave, yes I think we can do slightly better than “I know it when I see it” than in some other cases ;o)
For me causation requires that we have some understanding of why A causes B, which is more than just a mathematical or statistical regularity (and time ordering of events) that reliably explains what happens (including interventions). For instance when we say gravity causes some particular phenomenon, we aren’t just talking about that phenomenon, but the fact that gravity explains lots of things from apples (apocryphally) falling on physicists heads to the orbits of planets and stellar evolution etc. The assertion of causality there has consilience with a large body of existing knowledge, which gives us greater confidence. So any statistical conception of causality has to consider more than just the phenomenon under consideration if it is going to come close to our “I know it when I see it”. On the flip side, there is also the question of how much stuff that we already “know” do we have to sacrifice for this association to be causal? We certainly can do way better than Grainger causation, which is why they often say things like “Grainger causes” rather than “causes”.
Agreed dikran, one of the citing papers gave the example that Granger causation of weather by weather forecasts would be inferred on the basis that today’s forecast of tomorrow’s weather helps you predict tomorrow’s weather. And of course it works for historic τ+1-lag time-series.
A physical or chemical basis always strengthens causal inference. And even plain-old correlation. As per the moniker of this website 😉 .
I do see a parallel between the convergence criterion in cross-mapping, Bayesian updating, and a weak effect becoming stronger or becoming weaker and disappearing into noise, as you add more studies to a meta-analysis or narrow it down to objectively-defined “better” studies (e.g. clear end-points specified in advance vs. exploratory studies). In each case as you add more or better data the evidence for a true effect should get stronger, whereas a chance outcome that had looked like it was real should get swamped by subsequent randomness.
I don’t suppose Clive will read this comment, let alone the paper, but for the record, here is a good example of the traditional model-based approach to glacial cycles: Mid-Pleistocene transition in glacial cycles explained by declining CO2 and regolith removal. Of course it wasn’t just a shot in the dark, as the text and reference list shows – it built on previous work showing that that was the sort of thing that was needed to switch on the 100ka cycle. And unlike Clive’s numerology, that has consilience with geological expectations: there was a long time for continental weathering to build regolith, and some got cleaned off in every glaciation. And of course we know CO2 had been falling for tens of millions of years. Lots of detail on CLIMBER-2, Clive, which points up the silliness of you dismissing it as a black box. Funny how those who don’t like the answers feel the need to diss Teh Modulz. It’s almost as if they know their own quiver is empty. It even has dust – dust with a sensible geological basis, not arm-waving dust.
And more consilience: another CCM paper which identifies the latitudinal insolation forcings which drive ice-sheet waxing and waning, and confirms that that part of the process still has obliquity and precession as the drivers even with 100ka cycles (both actually, about equal, and precession alone is not enough – Fig. 3). Forcing of late Pleistocene ice volume by spatially variable summer energy. So something else changed to trigger the 100ka emergent behaviour. Eccentricity didn’t suddenly become the dominant insolation driver, in defiance of orbital mechanics. Damn, those non-linearities have a lot to answer for. Makes it so hard to overturn decades of science with an Excel spreadsheet. Another demerit though – I downloaded that in 2018 and didn’t follow through to the primary CCM paper.
A more recent paper has another take on the 100ka cycle: if I’m reading it right the 100ka cycle is related to the characteristic oscillation time of the photochemical/geochemical system, and only by coincidence approximates orbital eccentricity. It looks to me that they choose values which impose a 100ka cycle, which makes it something of a toy model although the values are sensible (IOW 10ka or 1Ma would not be sensible, but 80ka or 120ka would and then it wouldn’t fit 100ka). Although I wonder if there could be some sort of resonant locking to the weak eccentricity forcing as long as the period of the chemical cycle was close enough.
Science moving on. And a good example, which also arises often in evolution, of how having multiple viable mechanisms but not yet being able to pick a winner makes it more not less likely that a full understanding will finally be reached without the need for magical thinking.
Oops, missed the last reference: Self‑sustained oscillations and global climate changes
I follow Clive because I think he does some original research. Consider his results with triangulated mesh global temperature estimates, which he is working on in parallel with Nick Stokes. 99.9% of AGW skeptics I can quickly toss aside but when it comes to doing quality analysis you can’t let his anti-wind-energy politics cloud his results. That’s the way it has always been in research, and plus he’s nowhere near as rabid as someone like Willis Eschenbach (ever see his tweets?), who also appears to be technically skilled but uses his skill to mislead (as with Nic Lewis and Steven McIntyre).
https://moyhu.blogspot.com/2019/07/comparison-of-surface-temperature.html
From of Clive Best’s blog posts
That’s not new Paul. It’s how decades-old super-simple boundary-element models like Poly3D assign average values to the triangles in the mesh.
It suffers from the same problem as least-squares gridding or linear interpolation: values can be assigned to the unknown centre of a triangle which are completely out of whack with the actual value if you had a station there. Consider a large island with no stations, interpolated from shipborne data; a patch of forest with stations on the surrounding savanna, etc. No Arctic stations so no Arctic amplification. Etc.
The strength of kriging is that it tells you where it is no longer valid to extrapolate or even interpolate (yes you have no gaps on your globe, but some of the large triangles should have an undefined triangle in the centre where the locations are beyond a variogram range from observations). You then have to decide how to fill those holes. Which is a multiple-choice question, but that forces you to think about the choice and not blindly extrapolate beyond where it is valid to do so.
I agree on the hierarchy of contrarianism. But “CLIMBER-2 is a black box” is misrepresentation on a Whatsuppian scale.
Triangular meshes are great for representing arbitrary shapes. Most of my geomodelling in my final two decades was in Gocad, with triangular meshes and tetrahedral 3D elements (they call a 3D mesh a Solid – .so* but not a Unix/Linux shared object 😉 – but it’s the same thing). But all the flow modelling (and the input I prepared for others to flow-model) was done on a grid with six-sided boxes. Why? Because the challenges of numerically modelling flow other than on x,y,z axes are too great. Not just fully populated vs. diagonalised tensors, there is no simple way to define many of the input parameters for flow at (say) 45° to the axes (which are not chosen arbitrarily, but are chosen to give the best compromise between representing structural geometry and flow anisotropies in the rocks). It’s certainly not a simple ellipsoid in layered media like sediments, and the same applies I bet to a layered atmosphere. Especially one containing things like clouds.
And no arbitrarily large or arbitrarily small cells either. The solver will explode if you try to flow between those. Nor sudden changes in parameter values from cell to cell: that will explode it too. Not just singularities, but gradients too steep for the solver to converge in the allowed number of steps. So in reservoirs, and I suspect in climate models, you have to impose some smoothness requirement either subsequent to populating cells/elements, or up-front by averaging more than three points, with some sort of weighting.
* Actually a t-solid, so why not .ts? Because that’s already taken for t-surface, which is what they call a triangular mesh 😦 . Meshes and solids don’t have to be made out of triangles: I was company lead for an academic project we sponsored building generalised meshes where you could have the optimum number of vertices for that particular patch. And clever adaptive solvers to deal with my previous paragraph. But you go down not just one but several orders of magnitudes in size to get to something that can run on any reasonable computer in any reasonable time.
You haven’t understood.
The nodes of the triangles are wether stations and the mesh is dynamically generated as those locations evolve.
Basta!
“The nodes of the triangles are wether stations and the mesh is dynamically generated as those locations evolve.”
so how do you avoid artefacts in the time-series at a point away from a station caused by the mesh reconfiguring?
You haven’t made it clear who or what has been misunderstood, Clive. From what Paul quoted, Dave_Geologist’s discussion seems reasonable to me. And from what Paul quoted, it seems to me that averaging the three nodes implies linear interpolation – the surface of the triangular mesh element is the planar surface defined by the three points. For large mesh elements, assuming a planar interpolation scheme seem problematic.
..as for what Dikran says, let’s assume you have three stations at one time with values of 10, 11, and 12, with a huge triangle (i.e., a large gap). Let’s assume that gap has a mountain in it, and then you add a new station at the top of the mountain – right in the middle of the gap, where the average predicted 11 – that measures 0.
Now, you have three triangles, with averages of 7, 7.3, and 7.7 – covering the same area as the original single triangle with an estimate of 11.
Sounds like an artifact to me. (If I have misunderstood, please explain how rather than just doing another hand-wave.)
I am always working with anomalies so it doesn’t matter. Spherical triangulation is IMHO the optimum way to extrapolate the available temperature data over the earth’s surface in a consistant way.
Then the section Paul quoted “which I think are the most natural way to integrate temperatures over the earth’s surface. “ is inaccarute. It is not integrating temperatures, it is integrating anomalies. No wonder people are “misunderstanding” you.
And how is “spherical triangulation” not linear, if it involves simple averaging?
Clive,
Why do you regard it as optimal. Is it mostly because it’s a better way to average on a sphere?
This is nitpicking.
Why is it nitpicking?
Oh dear. Cover the global model with spherical triangles. These are equilateral and best divided at the midpoints of sides into 4 similar triangles. Continue subdividing until the quantities of interest have small enough gradients. Recombine when and where quantities are “calm”. In this way a cyclonic storm is subdivided sufficiently for an accurate representation and the area of calm behind the storm is recombined to avoid redundant computation.
So the quantities of interest are flows through the three sides. Each side flows into the side of one or at most two triangles, receiving flows from then same.
For height, use triangular prisms, subdivided horizontally into enough slabs for the questions to be answered. Some GCMs use up to 43 slabs which seem overly many to me.
Hope that is enough to be clear.
ATTP: It is optimum because the 3D spatial average avoids any 2D projection biases.
But it seems that the Cowtan and Way algorithm does a pretty good job too.
@David B Bensen
This is about interpreting real historical surface temperature data!
“But it seems that the Cowtan and Way algorithm does a pretty good job too.”
since superseded by HadCRUT5 and HADSST3 adopting their own similar 2D interpolation. Yet it is still far less transparent . Nick Stokes and my methods always gives a transparent result.
What’s your definition of “transparent”?
“I am always working with anomalies so it doesn’t matter.”
err, no, I would have thought a transient artefact would be present in the anomaly as well.
“You haven’t understood. … Basta!”, “This is nitpicking.”
This sort of thing is what makes me somewhat skeptical of Clive’s science. Interesting idea, had he been willing to engage with my question I might have gone and had a look. I’ll probably have another look at Stokes’ version…
something like this.
“Interesting idea, had he been willing to engage with my question I might have gone and had a look.”
It’s fine to be skeptical of anyones “science” but you need to use logic rather than abuse to disprove it !
abuse?
I did have a look, I couldn’t see anything that answered my question, but I did find:
If I were you, I would avoid statistical analysis until you do understand it. ISTR Cowtan and Way used it.
“It’s fine to be skeptical of anyones “science” but you need to use logic rather than abuse to disprove it !”
I did, I used logic to think about what you had said and I saw a potential problem and pointed out out. There was no abuse.
“This is nitpicking.”
This isn’t exactly how science is done either, there is no logic there, just avoidance of an inconvenient question. “I don’t know” would have been a perfectly acceptable answer and would have reflected rather better on you.
BTW I was also not trying to disprove anything, it was a genuine (if somewhat skeptical) question about the science.
Clive says “This is about interpreting real historical surface temperature data!
Make up your mind, will you? Is it temperature, or is it anomalies? It’s hard to accept that it is other people’s fault for misunderstanding you when you can’t express yourself clearly (or consistently).
Clive: “3D spatial average avoids any 2D projection biases.
Yet from what Paul quoted, you are treating each set of three points as a triangle, and simply averaging. That treats each triangle as a flat plane. Not 3D. A large number of small triangles might be a reasonable approximation of 3D, but it is not 3D.
And for at least the several decades since I was an undergrad, 2D map projections include equal-area projections. And in general, non-equal-area projections such as Mercator are mathematical constructs, so calculating the correct area just involves using the correct (matching) equations. UTM grids, frequently used as a coordinate system, involve a large number of Mercator projections (with the point of contact as a line of longitude, not the equator – hence the term “transverse”). They do that to minimize distortion and distance/area errors. I’m beginning to think you really don’t know much about the subject you are talking about.
And you’re not saying anything here that makes me think it is worth the time following any of your links.
A little bit back, Dave_Geologist said: Because the challenges of numerically modelling flow other than on x,y,z axes are too great.
Not necessarily so. I once worked with a heat transfer model that was written in 2D radial coordinates, not Cartesian. Perhaps a seemingly odd choice, but it was really useful for modelling heat flow around buried piles in soil. Frost heave, thaw settlement kind of work. The pile represented a linear heat source/sink of finite radius. Had to fudge the model a bit when you wanted to work in an approximation of a 2D Cartesian system, though: set the bounds at (some large value of R) to (some large value of R + the delta X you wanted).
And 3D GCMs sometimes used spectral approximations, rather than Cartesian ones. Not sure if any of them still do.
And if you go into numerical methods, there is the contrast between finite difference and finite element. In some cases, you end up with the exact same equations – it’s just the method of deriving them that is different. Finite difference is an approximate solution to an exact problem, whereas finite element is an exact solution to an approximate problem.
DtG said:
Clive was also analyzing the possibility of tidal cycles controlling behaviors such as the NAO and Arctic Oscillation, which he got published https://clivebest.com/blog/?p=7278 several years ago. The correlation he found was very slight, but believe this has to do with a non-linear influence. I have been refining non-linear solutions to the tidal equations and also applying signal processing techniques to extract the stationary elements and standing waves from the time-series (inspired by a paper I wrote with Bankes about 10 years ago). To the untrained eye NAO appears like noise, but once the pattern is found it becomes explainable. Yet, it will take lots of cross-validation effort to attract interest in the analysis. No doubt that some machine learning algorithm will also pull out the pattern. But have to give credit to Clive because he actually spent the time deriving the tidal tractive forces and published the results, even though it wasn’t all that convincing. Negative findings are often as important as positive ones as they give an idea of where NOT to look.
This chart is a preliminary one from the other day:
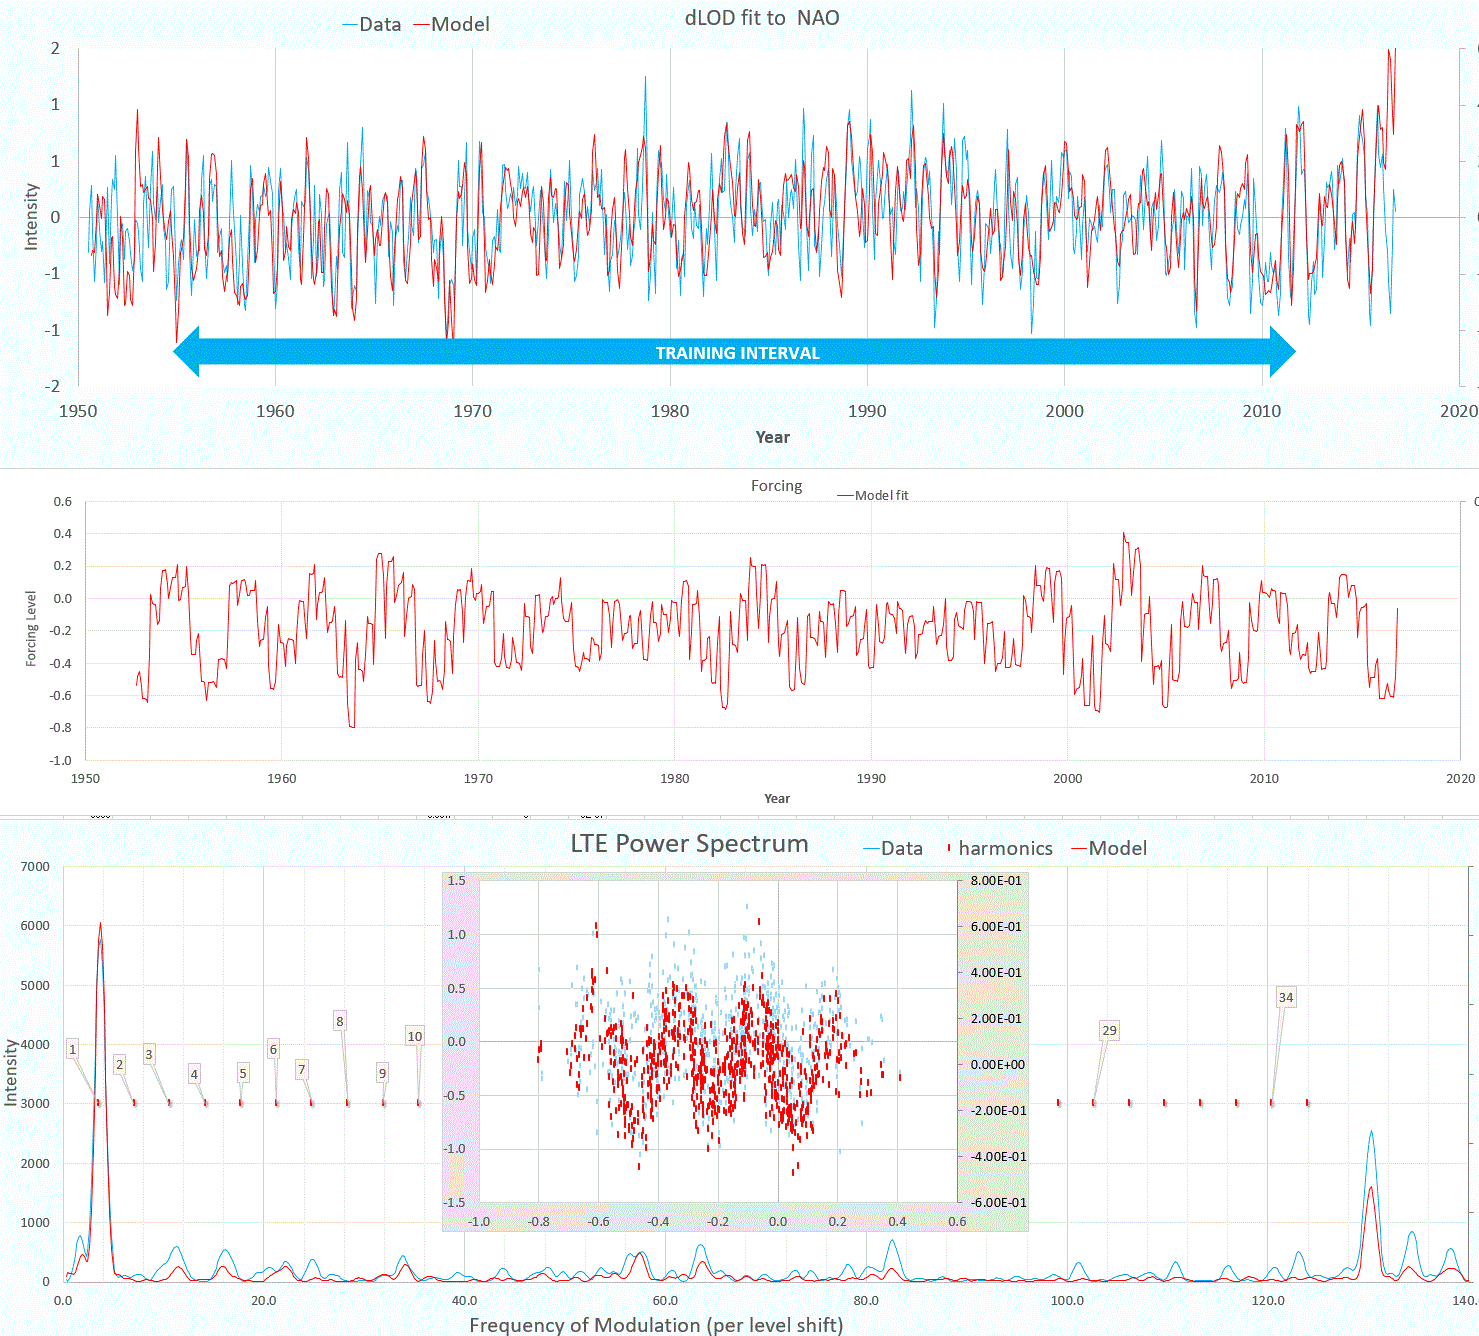
Remeshing triangles Clive? How very 1950s. My points about interpolating nonsense in the case of large triangles still apply, of course.
The value of a triangular mesh over a grid is that it better handles complex structures, where you want to adaptively vary the cell/element size without going down the labour- or cpu-intensive process of local grid refinement, and without the hassle of coding for flow from one cell face into ten or vice versa. Trivial where all ten have the same values, but then you wouldn’t have refined anyway, algorithm and solver hell where they don’t (algorithm in this sense includes defining the physics accurately, which is decidedly non-trivial) And of course for cases where some grid cells would be multi-valued however you defined the x,y,z axes. Some of which may apply to raw temperature records, which might reasonably display very rapid shot-term variation (think top to base of the Grand Canyon, never mind urban heat islands). Of course if you’re smart you grid temperature anomalies rather than raw temperature, a parameter which you expect to be smooth and slowly varying, where the correct approach to a 2°C difference between closely spaced points is to remove erratic points or average the closely spaced points into super-points, ideally after automated or manual QC.
You then have to decide between doing the parameter-mapping process in the grid you know you’re going to have to flow-model in, or a super-grid or sub-grid of that, or do something else like irregular meshing. Since the latter leaves you with the not-insignificant problem of numerically upscaling or downscaling your already-three-point-averaged values into the final cells, and also dealing with the problem of elements which span multiple cells, triangular meshing would need to deliver a very large candle to make the game worth it. I see at most a tiny night-light.
If you think a decades-old field with thousands of practitioners is doing something fundamental wrongly, you should consider the possibility that it’s you who are missing something.
No it doesn’t Clive. Other perhaps than by lucky chance, as a global average, which is not what I was writing about so maybe I did misunderstand that. Read yesterday’s post again.
(I’ve said before that C&W should have shown the experimental variogram(s), which would make things clearer, but there is plenty of stuff on Google about kriging, and you can roll your own in Excel for small datasets – I’ve done so.)
David, yes, horses for courses. I’ve used radial models myself for things like salt diapirs, where it is a good enough approximation. At least for reservoir engineering, you need to be careful about cell size to keep the solver happy (varying not constant R-steps).
But most reservoirs aren’t like that, and nor is the surface of the Earth for things other than poleward flow.
And of course “classical reservoir engineering” is all about circular, spherical, linear and other simple cattle (cattle because with injection you have a sink and source). My discussion was about when that doesn’t suffice.
Since you seem unable to clearly explain yourself Clive, or even distinguish temperature from temperature anomaly, I’ll not comment more on triangles. There seemed little point before after you’d Gish-Galloped past my previous points, but now that you’re Gishing dikran, ATTP and others, and inventing claims of abuse, I’m done.
Amusingly, I’m going to recommend a new piece of numerology on the allegedly insoluble change to 100ka cycles 😉 . A simple rule to determine which insolation cycles lead to interglacials.
Partly because they’ve introduced clarity of definition, and included the dogs that didn’t bark. Partly because they’re appropriately humble (here are our observations, you explain them, no hobbyhorse from mus, thank you).
And partly for the reference list (which is not paywalled), to emphasise that as I said above, the “problem” is not a lack of explanations, but a plethora of competing explanations, most or all of which are a priori plausible. The challenge is not finding an explanation, but picking the right one (or more likely, the right combination). It’s a useful pointer to show that the answer will involve a combination of (a) time lag since last event and (b) long-term secular change over 5Ma, crossing a threshold around 1Ma, although that was known qualitatively hence the directions pursued by previous physicochemical efforts at explanation.
Dave_Geologist: I’ve used radial models myself
The key is to identify any symmetry in the problem you are trying to solve, and using a coordinate system that best represents that symmetry. The example I gave was one where radial symmetry is obvious, so you essentially solve a 3d problem using a 2d model. Tremendous gains in computational efficiency. The instances you give as examples are very similar. Using a 2d model with radial symmetry to solve a 3d problem that does not have radial symmetry would be silly.
In theory, a global climate model could be written using a spherical coordinate system, but I don’t think it would make life any easier.
Expressing a spherical earth (well, mostly spherical) on 2d paper has always been an issue in cartography, and many solutions exist depending on what property you want to represent best. Going back to the Mercator projection mentioned earlier – why on earth (pun intended) would anyone use a map projection t hat distorts polar regions so badly? The answer is simple: the Mercator projection works well for compass navigation. A straight line between two points is a constant compass direction that will take you from point A to point B. It’s not the shortest route (unless you travel N-S or along the equator), but it will get you there. Great for navigation over short to medium distances. Not so great for comparing the size of Greenland to the size of Ecuador.
Match the tool to the purpose. Avoid reinventing the wheel.
If contrarians need to reinvent the wheel to contribute, I say good for them:
DtG said:
New motto: All models are wrong, maybe one day we will get one right. Consider all the geophysics phenomena in which there is little consensus or the consensus is fragile — an interesting page on unsolved problems here: https://subsurfwiki.org/wiki/Unsolved_problems_in_applied_geophysics
Examples from that page
— The Millenium Prize Challenge of solving Navier-Stokes, assuming applied to geophysical fluid dynamics
— If you are a seismologist working in Italy … the most important question is, “How can I predict destructive earthquakes so they don’t send me to jail?” 😉
From links to that page : Dynamics of storm tracks, Chandler Wobble, QBO, ENSO, Madden-Julian, AMO, NAO, etc etc. And of course, for the sun, the origin and prediction of sunspot cycles.
However, Clive should note that no one considers AGW to be an unsolved problem. And couldn’t find the origin of glacial cycles listed as an unsolved problem anywhere. It seems the coherence of orbital cycles with glacial cycles is enough evidence.
“Smith & Gregory (2012)”:
It is generally accepted that the timing of glacials is linked to variations in solar insolation that result from the Earth’s orbit around the sun (Hays et al. 1976; Huybers and Wunsch 2005). These solar radiative anomalies must have been amplified by feedback processes within the climate system, including changes in atmospheric greenhouse gas (GHG) concentrations (Archer et al. 2000) and ice-sheet growth (Clark et al. 1999), and whilst hypotheses abound as to the details of these feedbacks, none is without its detractors and we cannot yet claim to know how the Earth system produced the climate we see recorded in numerous proxy records.
Clive: how is this different from Dave_Geologist’s position above:
And partly for the reference list (which is not paywalled), to emphasise that as I said above, the “problem” is not a lack of explanations, but a plethora of competing explanations, most or all of which are a priori plausible. The challenge is not finding an explanation, but picking the right one (or more likely, the right combination).
Did you bother reading that? You’ve wandered into “if we don’t know everything, we know nothing” territory.
Willard: If contrarians need to reinvent the wheel to contribute
…but there are so many ways to reinvent the wheel, and a lot of them have very predictable outcomes (if the “new method” is old as the hills), and it gets really tiring seeing people claim to have a “better” method (or an “optimal” one, or [insert your favorite adjective]) when the results show every little difference from the previous work.
A few general comments. I think it’s great that Clive is doing his own analysis. It seems perfectly reasonable to me. I just don’t see how one can claim it’s the “optimal” way to do it, when it seems to be mostly confirming what other analyses already indicate.
As far as glacial cycles go, it seems clear that they’re associated with the Milankovitch cycles, it seems clear that albedo changes and changes in atmospheric CO2 (through ocean outgassing/uptake) are amplifying a relatively small global orbital forcing, but probably quite a large local orbital forcing. The precise mechanism might not be “known” but the basics seem clear.
Inefficiency is more a feature than a bug, Bob. Contrarians have earned enough in their past lives that they can afford to have Climateball as a hobby. They have time on their hand. Many of them will build websites with misinformation, conspiracies, and scapegoating. Very few will add anything constructive. What kind of activity would you prefer? New methods, whatever their demerit, at least help reinforce what we already know.
Sure, Clive will spin this as some kind of smoking gun. It is still a fairly low price to pay if you ask me. More so that this is where he provides all the tells readers need. For instance, here is where Clive took his quote:
Same emphasis. No source. A switcheroo between the representation of the Earth to an explanation of the ice ages. Bad Clive.
And so at least one contrarian read 50 papers on “Milankovitch theories.”
Willard:
As long as (most of) the time they spend on it is their own, it’s not much of a problem. And it would be preferred that they spend as much time saying “hey, the results showed that the science was largely correct” as they spend saying “the science is all wrong, I have a better way” before they do the work.
In other words, that they actually teach themselves something – even if the scientific community largely knew it already.
It becomes a problem when they find an uninformed audience with power [cough]Congress[cough] that then blocks the well-known science, ties up the time of the scientists that have to rebut the insinuations, etc.
But, as you say, that’s probably a feature, not a bug.
Of course it was because because “science of doom” reached the same conclusion.
You should try reading his series of posts on glacial cycles sometime. You might actually learn something !
There is no consensus on the dynamics of ice ages.
If you pretend there is – give me a reference !
No need to pretend anything to give you a reference, Clive:
https://climateball.net/but-consensus/
Should I add your line to one of the replies?
Just like the fact that we don’t know everything does not mean we know nothing, the fact that there is no consensus on every single point of climate science may not imply there is no consensus on fairly basic stuff, e.g.:
https://www.nature.com/articles/d41586-022-01192-2
Is this a line you missed from the paper, and how do you feel about Madeira?
You simply trivialise everything.
That’s not a knife, Clive. That’s a knife:
[ZEKE, KATE, GAVIN, NG, and MARK] Multiple lines of evidence establish that the planet is more than 1C warmer than it was before the Industrial Revolution, and that further warming poses severe risks to society and the natural world.
[CLIVE] The UK climate would improve with a 4 degree global rise in temperature – it would become like Madeira!
Srsly. Stick to methods. Common sense is not for you.
Clive “You simply trivialise everything.”
also Clive “This is nitpicking.”
And also Clive “For sure we have lots of problem but climate change is just a symptom not a solution, because we can wait 10 years until nuclear fusion is solved”
*Sigh*, Clive. We don’t know everything, therefore we know nothing.
Compare:
We need feedbacks to amplify the weak Milankovitch forcing, and we don’t have a clue what they could be.
We need feedbacks to amplify the weak Milankovitch forcing, and although we have at least a dozen candidates, some of which like secular regolith loss and isostatic adjustment time have been around for four decades, all with a solid physical, biological and chemical basis and no handwavium, unobtainium or sky-dragons in sight, we don’t know yet which ones are important and which not. But we’re working on it.
Then reread “The Relativity of Wrong”.
Yes, I know I’m late to those parties but some truths need a lot of beating in for some reason.
As a geologist the interesting ones for me are the processes with a c. 100ka duration or decay time. We talk about the geological response to a CO2 pulse taking about 100ka, but in reality that means somewhere between 10s of ka and 100s of ka. If the 100ka cycle is a mirage periodicity, and 100ka is an actual geological response time (or something close enough that it “wants” to be 80ka or 120ka, but eccentricity forcing is enough to tip the balance a bit early or late), that may be a calibration point we can use. There are other, distant-past, calibration points like the PETM, but the problem there is that geography and baseline climate were different, and process rates and even processes were probably different too. Plus we rarely have 10ka-level accuracy in the dating.
Watched an interesting lecture this morning while at the gym (haven’t seen the Q&A at the end yet)
Which tried to coin the term “optimistical” as the combination of hubris and humility that is necessary for science. Sadly (i) it is already a word, and (ii) the last thing we need is hubris (which is excessive pride or self-confidence) – it should be “self-confidence and humility” or “self-confidence and self-skepticism”. Seems quite relevant to the discussion, and the talk goes well with “The Relativity of Wrong” and perhaps a bit further.
Optimistical sounds like a portmanteau of optimist and mystical. Probably not what they are going for.
not sure where this fits in the various posts on this blog, so I put it here.
https://www.pnas.org/doi/full/10.1073/pnas.2108146119
“Prudent risk management requires consideration of bad-to-worst-case scenarios. Yet, for climate change, such potential futures are poorly understood. Could anthropogenic climate change result in worldwide societal collapse or even eventual human extinction? At present, this is a dangerously underexplored topic. Yet there are ample reasons to suspect that climate change could result in a global catastrophe. Analyzing the mechanisms for these extreme consequences could help galvanize action, improve resilience, and inform policy, including emergency responses. We outline current knowledge about the likelihood of extreme climate change, discuss why understanding bad-to-worst cases is vital, articulate reasons for concern about catastrophic outcomes, define key terms, and put forward a research agenda. The proposed agenda covers four main questions: 1) What is the potential for climate change to drive mass extinction events? 2) What are the mechanisms that could result in human mass mortality and morbidity? 3) What are human societies’ vulnerabilities to climate-triggered risk cascades, such as from conflict, political instability, and systemic financial risk? 4) How can these multiple strands of evidence—together with other global dangers—be usefully synthesized into an “integrated catastrophe assessment”? It is time for the scientific community to grapple with the challenge of better understanding catastrophic climate change…
Why the focus on lower-end warming and simple risk analyses? One reason is the benchmark of the international targets: the Paris Agreement goal of limiting warming to well below 2 °C, with an aspiration of 1.5 °C. Another reason is the culture of climate science to “err on the side of least drama” (7), to not to be alarmists, which can be compounded by the consensus processes of the IPCC (8). Complex risk assessments, while more realistic, are also more difficult to do.”
precautionary principle and risk management stuff. Not alarmed or alarmist, just think the authors here are right that this is an under-explored topic.
Cheers
Mike
Pingback: 2022: A year in review | …and Then There's Physics