
I commented in yesterday’s post that I’d like to understand the actual impacts of anthropogenic climate change better than I currently do. It’s one thing to understand that if we continue to increase our emissions, we’ll continue to warm, sea level will rise, polar ice will melt, and the hydrological cycle will intensify; it’s another to understand quite what impact these changes will actually have.
VTG, quite rightly, pointed out that there is already a lot of information about this in the IPCC reports, so I went and looked where he suggested. The WGII Summary for Policy Makers (SPM) – in particular Table 1 – is very detailed and probably illustrates Victor’s point; impact studies are inherently regional, which introduces large uncertainties. It also seems to make communicating this quite difficult; there are many regions and multiple impacts per region. Therefore, there’s isn’t a small set of nice soundbites that can be used to illustrate these impacts; you really do need to delve into them in quite some detail.
So, I thought I would try and do a bit of that here. The table in the SPM recommended by VTG is actually pretty detailed; it includes a range of impacts for each region, the confidence in each projection, the climate drivers, the risks for different timeframes, and the potential for adaptation (being WGII, this report focused mainly on adaptation). What I thought I would do below is reproduce the part of the table for each region and highlight one impacts, for each region, for which there is high confidence.
Africa :
- Reduced crop productivity associated with heat and drought stress, with strong adverse effects on regional, national, and household livelihood and food security, also given increased pest and disease damage and flood impacts on food system infrastructure. Under a high-emission pathway, the long-term risk is very high with little potential for adaptation.

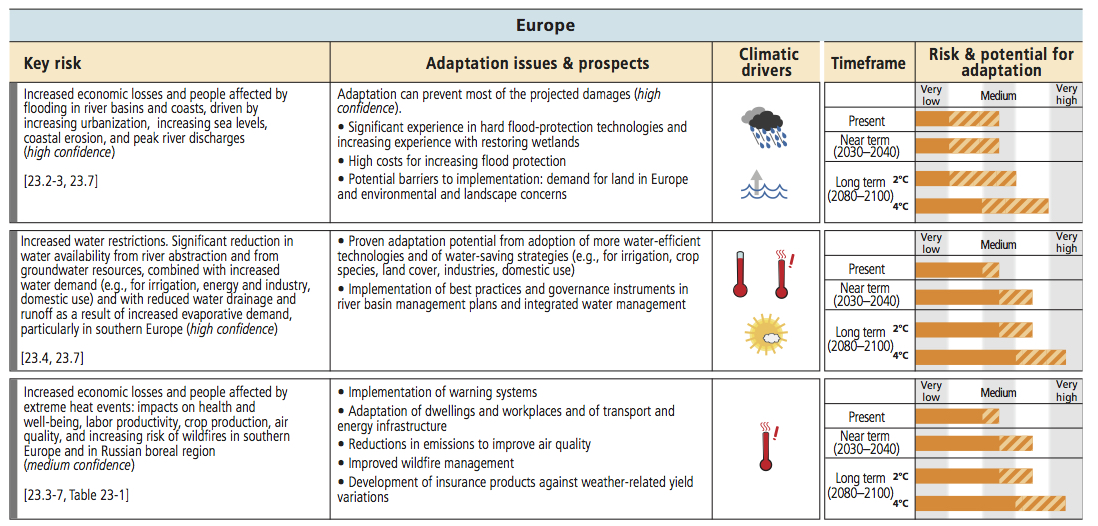
Europe:
- Increased water restrictions. Significant reduction in water availability from river abstraction and from groundwater resources, combined with increased water demand and with reduced water drainage and runoff as a result of increased evaporative demand, particularly in southern Europe. Risk is medium-to-high with some potential for adaptation.
Asia:
- Increased risk of heat-related mortality. Under a high-emission pathway, the long-term risk is very high with little potential for adaptation.

Australasia:
- Increased frequency and intensity of flood damage to infrastructure and settlements in Australia and New Zealand. The long-term risk is medium with potential for adaptation.

North America:
- Wildfire-induced loss of ecosystem integrity, property loss, human morbidity, and mortality as a result of increased drying trend and temperature trend. Under a high-emission pathway, the long-term risk is very high with not much potential for adaptation.

Central and South America:
- Spread of vector-borne diseases in altitude and latitude. In the medium-term this carries medium risk with potential for adaptation. No long-term risk information.

Polar regions:
- Risks for the health and well-being of Arctic residents, resulting from injuries and illness from the changing physical environment, food insecurity, lack of reliable and safe drinking water, and damage to infrastructure, including infrastructure in permafrost regions. Long-term risk is high, but with potential for adaptation.

Small Islands:
- Loss of livelihoods, coastal settlements, infrastructure, ecosystem services, and economic stability. Under a high-emission pathway, the long-term risk is very high, but with some potential for adaptation.

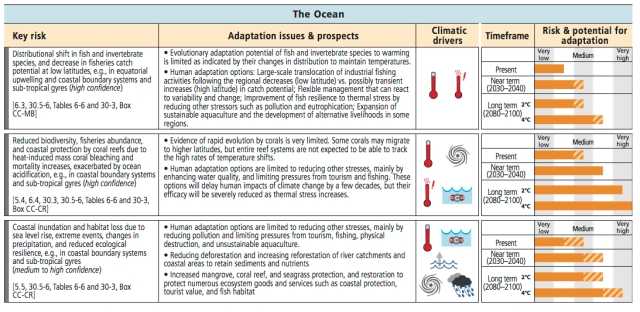
Oceans:
- Reduced biodiversity, fisheries abundance, and coastal protection by coral reefs due to heat-induced mass coral bleaching and mortality increases, exacerbated by ocean acidification, e.g., in coastal boundary systems and sub-tropical gyres. Under a high-emission pathway, the long-term risk is very high with no potential for adaptation.
So, there’s my attempt to look at some of the projected climate impacts. I’ve only highlighted one per region, but these are risks for which there is high-confidence and there is more information in the tables themselves. It’s clear that this is a very complex issue with no obviously easy way to communicate these potential risks. However, I do think that this is a very important issue and I would certainly like to understand it better, and also see it more prominently communicated.


ATTP: Methinks we should repost your excellent OP on SkS.
JH,
You’re welcome to, but this is just a very crude summary of what’s in the IPCC WGII report.
ATTP: You’re welcome. I concur completely with your belief that we need to do a better job of communicting what’s in the IPCC WGII report. Perhaps you and I could collaborate on a multi-part series for posting on SkS?
Reblogged this on jpratt27.
The number of comments indicates the problem with talking about impacts. For every impact you need a lot of knowledge of the specific system and knowledge which the natural scientists at this blog normally do not have.
Will The Netherlands evacuate before or after being flooded? An economist may expect the Dutch population to behave rationally and evacuate when the risk becomes too large and dikes too expensive. I expect that the Dutch people will only get out of their bathtub after a storm flood with lots of casualties, but how do you prove that? (Or actually I expect that The Netherlands will start geo-engineering to keep the temperature down, if that hurts the American farmers or causes even more fires in North America, well then they should have been more cooperative. The Netherlands will not let its history and culture drown.)
The section on Australasia highlights the problem of summarising a vast area that includes Australia, New Zealand, New Guinea, and some of the Pacific Islands.
Even within Australia the expectation is for more rainfall in the north but a reduction in winter rainfall in the south (already quite noticeable). Heatwaves and increased risk of bushfires are currently and will continue to be a major issue in the southern states but that does not even make what is presumably the top 3. http://www.climatecouncil.org.au/heatwaves-report
You probably need to look at the reports prepared by national science academies or the detailed WG2 report to get a better idea of what the impacts are likely to be country by country and region by region. e.g. http://www.climatechangeinaustralia.gov.au/en/ or http://www.amazon.com.au/Four-Degrees-Global-Warming-Australia-ebook/dp/B00FYR34UM
The most frightening graph in the SPM is just before the tables you used. Fig SPM.7 on page 18. Estimates of crop yield changes out to the end of the century. nearly 40% chance of crop yields declining by 25% od more. 20% chance of yield declines of 50% or more.
Though these are only probabilities, they are large enough that we need to take them seriously, Because if that were to happen, that would be the collapse of our food supply, mass famine and population crash due to starvation, and probably major social collapse.
That we would even consider not doing everything possible to avoid that beggars the imagination.
Glenn Tamblyn: Crop yields might go down, but much of the third world is starting to modernize, meaning that globally our net crop yields should go up. At what point that give out, I don’t know. The angry Stoat may help clarify this.
The most worrying aspect of some of the consequences of unmitigated climate change isn’t just the immediate impacts, as mentioned above, but the deep time they for which they will endure.
The warming pulse we unleash could last for tens of thousands of years – many times longer than the history of human civilisation.
Perhaps the worst effect would be a mass extinction and loss of biodiversity which would not recover for millions or even tens of millions of years (Kirchner & Weil 2000). That’s very likely longer than the entire future history of the human race. It’s sobering to think that no one who comes after us would ever know a world with the rich diversity of life which we have now.
anoilman, is the Stoat still angry? He seems quite jovial at the moment.
So, just a wee bit curious, WGII is the ‘adaptation’ report and WGIII is the ‘mitigation’ report.
Very simplistic,but those two words do appear to be thrown around a lot.
So in showing the ‘cartoon’ graphics from WGII, does that somehow imply an ‘adaptation’ strategy as opposed to a ‘mitigation’ strategy? Don’t mean to use the word ‘cartoon’ in the pejorative sense but what I see above are qualitative assessments not quantitative assessments. I would think that some kind of quantitative (economics) assessment is contained within the full report.
At this point I don’t know what to say other than I have about an order of magnitude more respect for the WGI report as I do for the WGII/III reports. Sorry.
“impact studies are inherently regional, which introduces large uncertainties.”
Which will, I’m sure, lead to many “egg-on-the-face” predictions. There are innumerable examples already. One recent one that springs to mind is the discussion we had on your “CO2 observed from the surface” thread:
Comparing the study with this one from one of the same sites Two spots with excellent data. CO2 forcing is observed to rise for both, so predictions about what *should* happen are obvious… yet:
* temperature goes up in on tne site, but down in the other.
Where temperature went up.. in the ’15 study:
* Precipitable water vapour declined:
–> total DWLW forcing declines..!
–> Clear-sky scenes got colder.
So, there are clearly problems in predicting what will happen regionally (as residents of NY and Boston are currently experiencing). The sort of predictions the IPCC are making are – from a political point of view – short term wins, but long term disasters because if/when they don’t come to pass it’s more ammunition for sceptics.
Pingback: Global warming = smelly armpits | RachelSquirrel
MikeH,
Australasia is just Australia and NZ. Papua New Guinea and the Pacific Islands are summarised in the Small Island States chapter.
Incidentally, the Small Island States and Australasian tables at IPCC meeting dinners are some of the most convivial. The SIS table is always the last to break at the end of the evening and has the most laughing. Always.
Says something about surviving in the face of disaster.
David Blake
Not much point worrying about that when all they need to do is make vague statements about ‘innumerable examples’ to create sufficient doubt.
One of the problems with analyses of impacts is the way that the need for evidence constrains the discussion. This is obvious in the emphasis on uncertainty but it also, I believe, leads to a unbalance in the focus on different impacts. Those impacts for which evidence is reasonably easy to find, for example sea level rise, or those regions which are more studied tend to get more air time than others, which whilst uncertain may have more significance for policy decisions than the attention they receive suggests. Of course the bad faith of much of the discussion ensures that this will likely always be the case.
OPatrick,
The other problem I have with the “ammunition for sceptics” argument is that half the time people who make such arguments are stating that science has to be open, honest, objective and free from bias, and the other half of the time they’re pointing out that some things shouldn’t be done because it just provides ammunition for sceptics when it turns out to be wrong, or to have large uncertainties. It just makes me think that people who make such arguments either don’t get this subtlety (science can’t both be objective and unbiased, and influenced by how some might attack it if something turns out to be wrong) or they’re essentially hypocrites.
@-David Blake
“Two spots with excellent data. CO2 forcing is observed to rise for both, so predictions about what *should* happen are obvious… yet:
* temperature goes up in on tne site, but down in the other.”
No, predictions about what ‘should’ happen are NOT obvious.
It is confirmation of the AGW theory that the CO2 forcing is observed to rise for both, it is predicted to be a global effect. But it would be idiotically simplistic to then predict that the two localities will show the same changes as the global metric.
This is one of the problems with predicting impacts, the global effect is well established, but how that plays out in a specific region is much more uncertain.
@-” The sort of predictions the IPCC are making are – from a political point of view – short term wins, but long term disasters because if/when they don’t come to pass it’s more ammunition for sceptics.”
If the predictions are locally wrong it is probable that they will over-estimate impacts half the time, and underestimate the impacts the other half.
Now we all know that ANYTHING can be ‘used’ by ‘sceptics’ as ammunition, but an under-estimate of impacts (as has happened for the Extreme Boston snowfall) should cause real skeptics to suspect that the IPCC predictions of impacts are (as with the rate of ice melt and sea level rise) ammunition for those that see the IPCC as consistently underplaying the impacts after the government and political advisor’s get a chance to edit the initial science draft.
With the extremely vocal, and in the US at least irrationally large, clique who think the IPCC overstates impacts it is sometimes easy to forget that there is inevitably a symmetry to the errors and those that are labelled extremists might have just a good a point as those who are seeking to minimise the impacts.
Given the uncertainty, probably a better one.
I don’t think the fact that there is some uncertainty around these predictions should be very comforting because the failed prediction could be in either direction. The impact could be worse than than they thought or not very noticeable. And there may be impacts that we are not even contemplating at the moment.
oops looks like I basically said the same thing as Izen. sorry about that
@oPatrick/Izen/aTTP,
I think the point about the comparison of the two studies (which are in no way representative of anything) is simply that: we really don’t know what the climate will do regionally. They show the hydrological cycle is the big *unpredictable* dog in the fight. So making proclamations about regional effects is a) rather foolhardy and b) not particularly useful for policy IMHO.
Stick to the big picture – the things that can be modelled well – or any small regional inconsistancy will be used to discredit the whole process (think “Viner moment”).
David,
IIRC, your regional examples were actually fairly precise locations in North America. I think there is a vast difference between consdering continental-scale regions and considering precise locations on specific continents. Furthermore, given that we will need to adapt to certain climate impacts, some idea of regional impacts is presumably important. It’s one thing for them, in some cases, to be uncertain; it’s another to simply do no such studies whatsoever.
David Blake
I’m thinking Viner moment… by which I presume you mean ‘loosely worded and ambiguous media interview which gets endlessly cited by ‘sceptics’ as the closest they can find to something that might be twisted to be a failed prediction’. Perhaps you can show where David Viner made an actual prediction which might justify the term “egg-on-the-face”?
What you appear to be suggesting is that if we cannot be confident of predictions we should not be discussing them at all. This seems far less useful for policy than only focusing on aspects we can be confident about.
> Australasia is just Australia and NZ.
And NZ is just some gunk coming grom the ocean, where birds fled and failed to develop a need to worry:
The story about kakapos might even help celebrate this festive day.
[Mod : Sorry, there are plenty of sites that would welcome a fact-free rant about the IPCC. This isn’t one of them.]
Always find it interesting how little focus is placed on the people of the Arctic in these types of things
Robert,
Actually, one of the things that struck me about the Polar regions commentary was that there appeared to be reasonably high opportunity for adaptation. I wondered what this might mean, and something that crossed my mind was that it might simply mean that people living there could move. However, I don’t know if this is actually what is meant. Do you have any idea of what would be meant be “potential for adaptation” when applied to people living in polar regions?
The Guardian seems willing to discuss the most worrying, in my view, if nebulous impacts of climate change – increasing numbers of climate refugees and the associated security implications. ‘Sceptics’ and ‘sceptic’-leaning commentators are often vitriolic in their condemnation of any such suggestion, using the lack of concrete evidence as a stick to beat editorials like this. Better to stick to things that can be ‘modelled well’, much less alarming but so much easier to defend.
Talking about pretty immediate impacts, has anyone else noticed that Arctic Sea Ice extent already seems to be doing something funny this year?
http://nsidc.org/arcticseaicenews/
If this carries on we may be heading for some alarming results.
In the meantime, Florida politicians have found a way to not have to discuss impacts of climate change: just ban the term “climate change”!
http://www.miamiherald.com/news/state/florida/article12983720.html
Bwana_Mrefu
Remember, we aren’t allowed to say ‘alarming’ because that is ‘alarmist’. Those who insist on being described as sceptics have made this very clear and if we ignore their demands we might stand accused of denialism.
On reflection I would like to withdraw a claim I made before and suggest it was in error. It was this:-
“If the predictions are locally wrong it is probable that they will over-estimate impacts half the time, and underestimate the impacts the other half.”
I think the probabilities for error in prediction are far from equal. It is the optimisation of current human agriculture and infra-structure that means that ANY change is much more likely to be deleterious than beneficial. This might seem similar to the quantum Hamiltonian space stuff that shows as there are far more disordered states than coherent states disorder dominates, or is more probable.
But it is more system specific than that.
The case of coastal city-ports, shows this. There is the possibility of some adaptation to small variations, but the only beneficial state is the status quo because that is what the system has evolved to operate most effectively within. Any significant change in sea level will incur costs for a port which are likely to be non-linear. A big fall would be almost as damaging to a port as a large rise, both would mean the abandonment of existing infra-structure and the construction of new facilities Past examples due to erosion or sedimentation are available..
A similar picture emerges with agriculture. It is optimised for present conditions with some limited ability to adapt in planting and harvesting times, and the strain of crop species used for hot/dry/wet/cold conditions. But if you are a fruit farmer and your region warms enough to prevent sufficient vernalization for a summer crop, its dig out the trees and find a new business.
Human infra-structure and agriculture are coherent and efficient under present conditions. The more conditions vary, in whatever direction, the more costly the damage. However uncertain regional predictions may be, the least probable is that conditions will remain unchanged. It is MOST probable that any change will impose adaptation costs, with strong evidence that the cost are non-linear, or have tipping points, in relation to the magnitude and speed of change.
@Bwana,
“If this carries on we may be heading for some alarming results.”
To be fair we have heard this before. The decline in Arctic ice has been carrying on [at least] since the satelite era but there seems nothing extra unusual about recent volume anomalies – if anything an uptick since the 2012 record minimum.
David,
Seriously? And you wonder why Skeptical Science does their elevator style graphics?
@David Blake – deserves a second, Seriously?
As The Guardian reported just this past week:
“New data compiled from a range of sources – from Navy submarines to satellites – suggests that thinning is happening much faster than models have estimated, according to a study aiming to link those disparate data sources for the first time. University of Washington researchers Ron Lindsay and Axel Schweiger calculated that in the central part of the Arctic Ocean basin, sea ice has thinned by 65% since 1975. During September, when the ice reaches its annual minimum, ice thickness is down by a stunning 85%.”
Much more recovery like this and we’ll have to shift all our attention to land ice ….
@aTTP,
😀 [Mod : redacted], but Bwana’s claim of something unusual in the 2015 data doesn’t seem to be accurate. The trend doesn’t seem to have changed: still down.
The trend was also down in the 1940’s article I gave, and in this 1954 article too. It seems a common human theme to claim the “Arctic is about to disappear”.
Arctic Ice has always been changing See Fig 5 in this paper . The Arctic ice area grew 5 million km^2 between 1960 and 1970.
David,
Yes, because we’re warming due to increasing anthropogenic forcings. This isn’t complicated!
@ O’Neill,
“As The Guardian reported ..”
There’s your problem right there..!
[Mod : Sorry, a bit too close to nonsense to actually bother posting]
@ David Blake – would you rather read the paper yourself (I doubt it), here’s the info:
R. Lindsay, A. Schweiger. Arctic sea ice thickness loss determined using subsurface, aircraft, and satellite observations. The Cryosphere, 2015; 9 (1): 269 DOI: 10.5194/tc-9-269-2015
@-David Blake
“Arctic Ice has always been changing See Fig 5 in this paper . The Arctic ice area grew 5 million km^2 between 1960 and 1970.”
And we know why it increased then, and we know why it is decreasing now.
Or did you think such ‘always changing’ happens by some sort of acausal magic?
Because we know the cause, it is possible to project the likely magnitude of the effect. Although as others have pointed out the IPCC has been notoriously bad at ice projections. Blaim the models for underestimating the rate of possible loss. Look how many people said that the Larsen C would go years ago compared with how many have said it would be millennia….
Click to access j10J001.pdf
If that does not reduce the public confidence in the reliability of scientific projections, as dangerous underestimates of the impacts, I don’t know what will.
David Blake:
Actually, the units for figure 5 are 10^5 km^2, so that is actually 500 thousand km^2 growth in Arctic sea ice area, not 5 million.
Here you can see that growth in context (up to 2009, only):

(Source)
I’m rather irritated by the habit of IPCC dividing the impacts on continental scale.
That being said it’s not too easy to say with much confidence especially on areas of low orogeny what the most notable impacts will be. Still, there are areas that that would need the separation of impacts to categories by seasons and climate types. This would make a whole lot more sense, but would likely still leave a whole bunch of areas on which the main impact isn’t easily stated. What to say of f.e. the recent likely climate driven changes near the Great Lakes, one year there’s a spring heat wave (2012) then soon after there is a harsh winter (2014) by 20th century scale and this winter Siberian High was suppressed by some mbars and the real cold stuff from Arctic ran into the area. I remember also hearing of drought-induced crop losses in summer and summer heat waves here, interspersed with more northerly tracks of tornados than usual. Maybe the summer impacts are more confidently predicted here, but then again other areas like central Europe the summer impacts have been quite unpredictable, heat waves and floods have been following each other. I guess most areas on earth will have some uncertainty of impacts during some part of the years, but incorporating all of the studies involving local impacts would make the section II a whole bunch thicker.
The thing about the arctic is… in winter there’s no sun. Any ice loss during winter thus has to be a result of only greenhouse gases and internal variability. Increased amount of clouds will slow down the atmospheric cooling in winter. In the summer, instead, the clouds here have been blocking the sunlight, and thus preventing ice losses, but this may change, if the clouds get too warm they may rain (and not snow) over the ice melting it pretty fast. Also, if there’s a notable increase in winds in summer driving the clouds away the ice loss would be very rapid due the constant sunlight. The last two summers have been quite cloudy over the Arctic, especially during the warmest part of the year, July, so the area and extent present in recent summers (not talking bout volume) could well be just an internal variability at work. My guess is the polar vortex will continue to be weak during summers producing a whole bunch of small low pressure systems over the arctic pack ice, and once these get too warm they’ll rain out and it’s bye-bye Arctic sea ice.
Straying away of regional impacts. People should look on the more detailed models of climate, and deduce themselves what the impacts could be for their specific area, it’s clear that governments may downplay these, at least in the IPCC, simply for the reason they have pretty strict limits of chapter length. No way all the regional data thus far produced can make it there.
jyyh, regional (actually local) impacts are what the policy people require from the IPCC so telling the IPCC not to do regional impacts is telling it to go out of business
Eli, thanks for the clarification, maybe it is time to do the regional reports separately then. All I was trying to say was the climate impacts do not follow political boundaries nor are uniform in every season. I should probably RTFM and the part II of the report. National reports on impacts can though provide more local information than the ‘grand uniform report’ of IPCC ARII. It’s not likely policy people care a lot about things happening outside their constituents.
@Tom Curtis,
“Actually, the units for figure 5 are 10^5 km^2, so that is actually 500 thousand km^2 growth in Arctic sea ice area, not 5 million.”
Oops. Thanks for pointing that out, and for the SkS graph. Curious. In the 1979 paper the trend from ’53 to ’77 in sea ice was up:
“Conclusions:
…
2) The trend for total Arctic ice extent computed from the 300 month sample is positive and statistically significant…”
But for the same period in the SkS graph the trend is down. Which one is correct?
@David Blake: It’s quite likely they are both ‘correct’ – Fig. 5 in the 1978 paper is a) monthly data, and b) 24 month running mean. Neither of these is the same as the SkS graph which uses the same (though updated) dataset, but is looking specifically at July -Sept values.
@ONeill,
“It’s quite likely they are both ‘correct’ ”
Really? Taking the annual data (not just the summer data) from the SkS plot (first column here) and comparing it with the 300 month smoothed other paper they are very different. E.g.
from 1961 to 1974 in the ’78 paper ice grew ~0.3 million Sq Km
from 1961 to 1974 in the SkS data ice fell by ~0.2 million Sq Km
In short: the trend has been reversed.
David,
Who cares? There’s no great value in discussing why the data in a paper published almost 30 years ago happens to be different to the most recent data available. And, if you final comment is some hint that you think there’s a conspiracy, you can go and say silly things like that elsewhere.
@aTTP,
You are correct of course. Data changes to the equivalent area of a country like France mean nothing.
David,
I didn’t say any such thing.
David Blake:
If you look at Walsh and Chapman (2001) you will see that their primary source of data from 1972 onwards was satellite data from the US National Ice Center. In contrast, Walsh and Johnson (1978) still rely on a combination of shipborne and airborne observations from a variety of national services (as does Walsh and Chapman prior to 1972). Walsh and Johnson note the problems with missing data that arises from using ship and air borne observations. It is reasonable to surmise that the different data sources is the primary cause of the difference you note. Part, however, will be due to the different smoothing methods (annual average vs running 24 month smooth).
David Blake:
Frankly, France is a piddling little country by area (not of course, culture and influence), being smaller than all but two of Australia’s states. More importantly, in terms of Arctic Sea Ice extent or area, the difference you are talking about is well within the noise from annual variation. Therefore such a change is not a big deal, and certainly has no appreciable influence on the overall decline in Arctic Sea Ice extent in the late twentieth century. So, in context, they do in fact mean next to nothing.
izen said:
I think this is important to revisit. The variability and trend in the global warming signal is not at all difficult to model in terms of well-known factors. Much of the variability is related to ENSO, which some might consider is “acausal” but is likely as causal and ultimately predictable as the tides.
So this is how well we can do by adding in the known factors, green is the model and blue is the data:

The magical mystery is only in the fact that climate scientists do not seem to want to show how well they can do in accounting for these factors. Beats me why they don’t want to push this view.
WHUT
If you put it forward for publication, you’ll find out…
WHT, how well we can do adding in “known” factors is shown only if you do not include the ad hoc temperature adjustment circa 1945. Even then, that compares to just one temperature index. Other temperature indices vary from GISS LOTI by a greater amount than does your model. For instance, the BEST LOTI only has a correlation of 0.984 with GISS LOTI. Given that we know your model does not include many known forcings, and does include one forcing not known to be a forcing (nor with any known physical mechanism whereby it could be a forcing), that represents a problem for your model.
Has the “elevator-style graphics” been “published” ?
I do have a paper in the pipeline on modeling the Southern Oscillation Index http://arxiv.org/abs/1411.0815. This was submitted to Physical Review Letters.
This actually a lot of fun, sitting here from the outside and watching how climate science operates.
WHUT,
similar models to yours (at least as far as I understand yours) have been published.
http://www.skepticalscience.com/rahmstorf-foster-cazenave-2012.html
The bad news is that a skeptic (such as myself) might think that unless you publish your model in the same way they did theirs, there are, in fact fundamental flaws in your work that would not pass peer review.
Such as taking length of day as causal vs global temperature.
The good news is that publishing your model would open the way to changing the mind of any such skeptic, and convincing the community to push your view.
The recent paper by van Hateren [1] excluded the entire range from 1942-1950. This paper was published so I assume that I can add a correction from 1942 to 1946.
[1]J. Van Hateren, “A fractal climate response function can simulate global average temperature trends of the modern era and the past millennium,” Climate Dynamics, vol. 40, no. 11–12, pp. 2651–2670, 2013.
One of the skills in working correlations is trying to eliminate intervals that contain obvious errors.
And your point is? All these time series seem to use the same SST to cover the ocean.
I use GISS because it is also very close to NOAA/NRDC.
Speaking of Arctic sea ice extent…
As we reported on February 18th, some of the Arctic sea ice extent metrics reached the lowest levels for the date in their respective histories quite some time ago. Today though, we’re looking at a full house. The daily NSIDC and IJIS extent numbers have both been at all time lows for the date for quite some time now.
Arctic Sea Ice Area Lowest Ever (For the Date!) by Jim Hunt, The Great White Con, Mar 8, 2015
Excellent. That means that I don’t have to publish mine!
I wonder how the paper by Dickey [1] passed peer review? Do geophysicists from NASA JPL get a free pass? Are they simply being humored?
[1]J. O. Dickey, S. L. Marcus, and O. de Viron, “Air temperature and anthropogenic forcing: insights from the solid earth,” Journal of Climate, vol. 24, no. 2, pp. 569–574, 2011.
BTW, length of day may not be “causal”, but instead a measure of what is happening.
Speaking of Greenland’s ice sheet…
Greenland Reels: Climate Disrupting Feedbacks Have Begun by Bruce Melton, Truthout, Mar 5, 2015
WHT
All your questions would be answered if you submitted your work for publication.
And everyone would be much more likely to take it seriously.
WHUT – isn’t the biggest difference between what Foster and Rahmstorf did and the CSALT model that they start with a temperature record and adjust/correct it, while the CSALT model requires no temperature dataset input?
And then there’s the matter of fresh water…
Changing precipitation and melting snow and ice are already altering hydrological systems in many regions. Glaciers continue to shrink worldwide, affecting villages and towns downstream. The result, says the Intergovernmental Panel for Climate Change, is that the fraction of global population experiencing water scarcity is destined to increase throughout the 21st century.
Why fresh water shortages will cause the next great global crisis by Robin McKie, The Guardian, Mar 7, 2015
Pingback: Summary of climate change impacts
KO,
Perhaps — I am not sure of all the details of the Foster-Rahmstorf treatment. I started with a couple of premises. The first premise was that I thought that the earth’s climate would try to level its Gibbs free energy content. This was a thermodynamic treatment that assumed that factors such as temperature, kinetic energy (i.e. LOD shifts), pressure, and other energy forcers (such as radiative forcing) would act together such that a first-order variational principle could be applied. So I placed the temperature on the LHS of the free-energy equation and I juggled the RHS factors to minimize the error between dT and the CSALT factors (c.f.). So when you see a correlation coefficient of 0.99, this indicates the goodness of fit of dT with respect to the CSALT thermodynamic factors.
The second premise came from the first, in that I knew that I should not use a temperature data series to extract temperature. I thought that this would introduce recursive errors to the treatment. So I used pressure for ENSO instead of using one of the SST-based ENSO measures.
What I view as nonsensical, is that climate scientists will show GCM trial outputs that are clearly completely out of phase with the ENSO data, and act as if that is perfectly OK. I have to ask what world they live in that they cannot see that the ENSO variability matches the world’s temperature fluctuations almost note-for-note. I view that solving the ENSO behavior is solving the problem. I don’t inhabit their world of hypotheticals and so am not afraid to call something that quacks like a duck and swims like a duck, a duck.
Yet, however much I may not like this wishy-washy attitude in the consensus view, the skeptics are worse. I have been monitoring how some of them have been handling time-series analysis at places such as Lucia’s and it is outright embarrassing how they can misconstrue the meaning behind the variability in the global time-series. What I am trying to do is knock some sense into them — if that is even possible. Hit them with the obvious, as they certainly don’t believe in what the GCMs are saying.
Incidentally, does anyone know if the Foster/Rahmsdorf work has been updated to 2014 anywhere?
@-WHT
” The variability and trend in the global warming signal is not at all difficult to model in terms of well-known factors. Much of the variability is related to ENSO, which some might consider is “acausal” but is likely as causal and ultimately predictable as the tides.”
Obviously ENSO is deterministic with a causal base. I am not convinced that makes it as predictable as tides.
Historical records show that, all other climate factors being roughly stable, the ENSO cycles have ticked round for millennia. It appears to be a quasi-periodic system. That is there is an envelope of periods and amplitudes within which the cycles operate, but predicting the specific period or amplitude of any one cycle is … difficult.
This could indicate it is an analogue of the ‘dripping spigot’ chaotic system. A clearly defined envelope of behavior, constrained by the input ‘energy’, but individual drop intervals and size is deterministic but unpredictable. Or it could be a physically defined oscillatory system that is coupled to seasonal and past conditions that triggers the timing and magnitude as ‘beat’ effects between the inherent cycle time and the seasonal drivers.
The problem in both cases is that whatever degree the envelope of the cycle can be predicted under stable climate conditions it is likely that with a changing climate the cycle length and magnitude of the positive/negative excursions will change. I understand there is some evidence of this in the historical ENSO record.
The more obvious question is why didn’t Foster & Rahmstorf project their approach backward in time to 1880?
I really don’t understand how they make their decisions. In science, one usually goes for the kill.
Lucifer,
and, in context
To quote this out of context, as you did, is mendacious:
izen,

When I started to read the research on ENSO, there was an emerging consensus that the nearly periodic quasi-biennial oscillations (QBO) was tied as a forcing, via atmosphere/ocean coupling.
As it turns out, a periodic forcing such as QBO stimulating a perturbed 2nd-order oscillator can easily recreate the kind of quasi-periodic behavior that ENSO is known for.
I am fairly convinced that ENSO will get figured out in the next few years. Climate scientists claim that they can reproduce QBO with little problem, so ENSO is next.
The nonlinear chaotic system argument is bogus in my opinion, and a crutch for the weak-minded ready to toss in the towel when it comes to understanding science.
One cannot predict impacts if one cannot predict states.
The statistics of my oven are an average temperature only slightly above room temperature.
But that’s not enough to cook anything.
To predict the impact my oven, you’ll have to predict whether I want to make cookies, or not.
And right now, I’m doing Atkins, so…
How can you identify a water boiler? Maybe by the devil in the details.
The nonlinear chaotic system argument is bogus in my opinion, and a crutch for the weak-minded ready to toss in the towel when it comes to understanding science. …
No chaos for cooling phases is not a crutch!
WHUT
From memory, they wanted to use UAH and RSS LT data as well as surface data so they had to stop in 1979.
Does anybody take the results of GCMs such as CMIP5 seriously when they claim to follow the variability in the temperature record but are clearly in-and-out-of-phase and all over the map?
Kosaka and Xie [1] nearly committed blasphemy when they used the Pacific oscillations “as is” to explain most of the natural variability.
Kosaka, Y., & Xie, S. P. (2013). Recent global-warming hiatus tied to equatorial Pacific surface cooling. Nature, 501(7467), 403-407.
I take a duck very seriously when it quacks like a duck and swims like a duck.
My take on the situation is basically one of incredulity. I wouldn’t have spent so much time trying to understand the dynamics of ENSO if we didn’t believe that ENSO is the primary factor over short-term global temperature variability. To top it off, UAH and RSS almost exaggerate the impact of ENSO.
VTG
I’ve wondered this, and I think the answer is ‘no’. Certainly there’s nothing on his PIK page.
* * *
Quite.
@-WHT
“The nonlinear chaotic system argument is bogus in my opinion, and a crutch for the weak-minded ready to toss in the towel when it comes to understanding science.”
I think I know what you mean. There is an ‘Its chaos, therefore any random thing can happen and it is completely unpredictable’ mistake embraced by some who WANT the science to be intrinsically unknowable.
But any, even shallow, acquaintance with chaotic systems, even just at the level of the dripping tap will quickly demonstrate that chaos systems are mainly characterized by tightly constrained envelopes of behavior. most often they exhibit a bistable state with transitions occurring with a limited variation of period and magnitude. I suspect they can imitate a perturbed 2nd-order oscillator under those conditions. ( do not try making a chaotic music melody generator, very boring tunes!). It can be difficult to see any other form of behavior from some Chaotic systems, it takes a lot to force bifurcation and get multiple states and transition periods.
But if the driving input is appropriate, as is seen with the dripping tap, beyond a certain point there is a rapid sequence of value bifurcation and the really quasi-random variations appear that most people associate with chaotic systems, rather than the quasi-periodic behavior they can show. And usually do for most values of driving energy.
WegHubTelescope:
You are expecting GCMs to do things that they are not designed to do. David Appell succinctly explains why in a recent article…
4. Climate Models Don’t Do Short-term Predictions
Climate modelers don’t know the future — if they did, there’d be no need for their models.
In particular, they don’t know what volcanoes will erupt in the next decade or two, or how the Sun’s irradiance will change, or what El Niños and La Niñas will occur. And models cannot yet predict when these ocean cycles — and longer cycles like the Pacific Decadal Oscillation and Atlantic Multidecadal Oscillation — will occur naturally.
And that’s not all. Aerosols, tiny particles that float in the air, have a major effect on climate. They are emitted by volcanoes, forest fires, microalgae; about 10 percent of them come from burning fossil fuels. In reflecting sunlight, their latitude matters a lot.
“The CO2 forcing and other greenhouse gases are quite predictable,” says Gavin Schmidt, director of NASA’s Goddard Institute for Space Sciences (GISS), “but aerosol forcings are insufficiently constrained.”
All these factors can influence long-term climate trends for a year, a decade, or longer. So climate models in reality can be wrong from the day they offer up their output. But climate models aren’t intended to calculate short-term variability — at least not yet. Instead, they use energy conservation over the long haul — many decades to centuries — over which these shorter-term effects average to, or decline to, approximately zero.
So climate models can only do “projections” — calculations based on a set of assumptions — and they can’t do predictions. They can’t plot the exact path climate change will follow.
They can tell the likelihood of where climate will end up — with uncertainties — but not how we’ll get there. Especially for the first few steps out the door.
Top Lessons to be Learned from Warming ‘Hiatus’ by David Appell, Yale Climate Connections, Mar 5, 2015
The nonlinear chaotic system argument is bogus in my opinion, and a crutch for the weak-minded ready to toss in the towel when it comes to understanding science.
Precipitation, the focus of many of the impacts which constitute the subject of this post, is determined by fluid flow. Fluid flow is described by non-linear differential equations. The solutions to these equations are chaotic, thus unpredictable. Is there something you think makes these statements untrue?
Lucifer,
It’s not so much about true versus untrue, but about the relevance of what you’re saying. Something being chaotic does not mean that the system is completely unpredictable. A double pendulum is not going to follow some kind of trajectory that leads to the entire system jumping off the table and landing on the floor. It is called “deterministic chaos” for a reason.
Pingback: Critical thought? | …and Then There's Physics
Lucifer: interglacials triggered by orbital forcing. Same result every time. This climate agnosia is denial in a sciency mask and fools absolutely nobody.
Too bad Lucifer that you haven’t kept up with the research on the hydrodynamics of sloshing. Given a known forcing, the behavior of sloshing appears quasi-periodic but is actually predictable.
And again, try to explain how the Quasi-Biennial Oscillations can be modelled if you say that fluid flow properties makes this impossible, and then consider that this behavior is intimately tied to ENSO.
From the work I have done in solving shallow water wave equations for various forcings to simulate ENSO, it is not surprising to see that the QBO fundamental periods pop out.
Like I said, it is your lack of belief in what science can do that makes you so negative. My attitude is to light a fire and get people interested in what can be potentially accomplished.
I’ve just noticed that one of the other featured writers at The Libertarian Alliance website is dear old Godfrey Bloom. Non-UK readers may not have come across Mr Bloom, but over here he has achieved a degree of non-seriousness. This is the man who – unforgettably – resigned from Ukip because it was too politically correct.
He really did.
Web,
The QBO is probably a good example – it can be modeled, but it has different durations and you still can’t predict the correct phase. Ten years from now you have no means to accurately predict whether the QBO will be easterly or westerly.
Just as we have no way of predicting whether there will be a ridge over Western Europe or a trough two weeks from now.
OR whether there will be more or fewer than average troughs over Western Europe ( or anywhere else ) over the next month, year, decade, or century.
Lucifer, Sure can. The QBO periodicity is 2.33 years, which means that it locks into place every 7 years.
The QBO data only goes back to 1953 but I extended it earlier and used that as a forcing to show that it is plausible.
Your problem is that you don’t do the heavy lifting. Ain’t it always that way with the armchair skeptics?
Thanks for the wonderful synopsis. Very useful.
Pingback: Consensus and geoengineering – how to convince people about global warming | Enjeux énergies et environnement
Pingback: Consensus and geoengineering - how to convince people about global warming
Lucy, where did you run off and hide to?
What did I tell you that it is just a matter of time until these seemingly complicated periodicities are figured out?
Pingback: Matt Ridley on fossil fuels | …and Then There's Physics
Many thanks for this graphic clarification of what is happening. It really helps. Not being a scientist (and I hate that phrase, due to its continued use by greedy US politicians) I sometimes struggle to understand climate science reporting.
Also, mentioned in the comments above, was some discussion of adaptability in the polar regions. Might I suggest that the Inuit and others who have always lived in the arctic/polar regions are more adaptable as a people, having spent generations living primarily what the land and sea given them. As opposed to us down here in the temperate zones who would barely survive without cars, takeout food and gourmet bottled water.
Anyway, I am enjoying your blog.
Nan
Currently residing in Florida, where and words or phrases that relate to climate change have been struck from the language of government.
Nan,
Good, glad it was useful. Thanks, also, for the feedback.
Pingback: Matt Ridley is wrong again on fossil fuels
Pingback: Lukewarmers part II | …and Then There's Physics
Pingback: Talking solutions and motivating action | …and Then There's Physics