
Mike Hulme, Professor of Human Geography at the University of Cambridge, has a somewhat bizarre article published in Academia Letters called Climates Multiple: Three Baselines, Two Tolerances, One Normal. It’s basically a discussion of the recent World Meteorological Organisation (WMO) decision to re-define the present day climate as the period 1991-2020, replacing the period 1961-1990.
The article starts by suggesting that this means that
Climate will ‘change’, one might say, in an instant; the world’s climate will ‘suddenly’ become nearly 0.5°C warmer. It is somewhat equivalent to re-setting Universal Time or adjusting the exact definition of a metre.
Well, from the mid-1970s to the early 2000s we actually have warmed by about 0.5oC. This has nothing to do with how the baseline is defined. It’s also hard to see that it’s equivalent to adjusting the exact definition of a metre. I also wonder if Mike Hulme has got this the wrong way around. If we make the baseline period more recent, then the anomaly values actually go down, not up. You might argue that the change in baseline has caused the world to suddenly become 0.5oC cooler, rather than warmer (it hasn’t, obviously, but the change has reduced the anomaly values by about 0.5oC).
The rest of the article discusses the various baselines (present day, pre-industrial, historical) and what we might mean by a climate normal, but I don’t really get the overall point. Clearly we have to be careful about how we discuss climate change, be clear about what baseline we’re using, and be aware that what might be regarded as normal is changing. But this is a feature of the topic; it’s not something that can really be avoided.
It may be also technically true that
The adoption of particular baselines and tolerances is an overtly political process with geopolitical, ethical and technological consequence
but it’s also the case that none of these decisions change physical reality. Changing the baseline does not change how much we’ve warmed, how fast we’ve warmed, and how much we will warm if we continue to emit greenhouse gases into the atmosphere. If this is carefully communicated, it’s hard to see how these changes have any real political significance (on top of the political significance of climate change itself, of course).
In some sense, Mike Hulme’s article seems to be doing the very thing it’s cautioning against. The only way that changing the baseline, or what we regard as a climate normal, can have any broader political significance is if people overplay the significance of making these changes. Suggesting that redefining a baseline has geopolitical implications would seem to be an example of doing so.

Hmm. I have not bothered following the link to Mike Hulme’s article, but I do know that the WMO has used 30-year periods to define “climate normals” for many, many years, and the WMO policy has been to recalculate those normals every 30 years – i.e., calculate new normals once the 30-year period no longer overlaps the old ones.
Some countries recalculate normals every 10 years. – e.g. Canada:
https://climate.weather.gc.ca/climate_normals/index_e.html
From the above link, you can see that Canada has been doing this at least as far back as the 1941-1970 period.
Asking Da Google about WMO and climate normals easily turns up a couple of links:
https://library.wmo.int/index.php?lvl=categ_see&id=10986#.YARX4aaVthE
https://library.wmo.int/doc_num.php?explnum_id=867
The first includes a reference to a report om climatological normals for the period 1931-1960. The second is a report on methodology dated from 1967.
If the WMO is supposed to be acting politically in suddenly re-defining climate, they’ve been planning this sudden change for a very long time.
“Clearly we have to be careful about how we discuss climate change, be clear about what baseline we’re using, and be aware that what might be regarded as normal is changing.”
The baselines for studies on climate change will remain the same. So the official WMO period remains 1961-1990. (Many global temperature datasets have different baselines, but they will also stay the same.)
That the most recent 30 year period is used to described the state of the climate (not the change, the current state) is something climatology has done since 1900. So if this is political, one will have to look at politics a century ago.
1901-1930
1931-1960
1961-1990
1991-2020
What did recently change is that in future these computations of the current climate will be done every 10 years, not every 30 years (WMO, 2017). That makes sense as the climate is changing and the climate 60 to 30 years ago is not a good description of the current climate.
WMO, 2017: WMO Guidelines on the Calculation of Climate Normals. https://library.wmo.int/doc_num.php?explnum_id=4166
Bob,
Yes, exactly 🙂
If 2020 on average is “0.7 degrees warmer than normal” and 2021 is 0.1 degrees warmer than 2020 then (because of the new baseline, up by 0.5 degrees) 2021 is on average “0.3 degrees warmer than normal”. Those who have not paid attention when the normal was changed may conclude that 2021 is cooler than 2020. Confusing?
Victor,
Thanks. Yes, I didn’t got into that detail, but it’s useful to have it pointed out. This doesn’t change what baselines will be used for studies of climate change.
I didn’t realise it went back quite that far.
Indeed, it’s not some kind of nefarious decision intended to inflame geopolitical sensitivies. It’s because the climate really is changing fast enough that updating the baseline every 30 years would mean that the baseline would soon not be a good representation of the current climate.
Also note that the process of calculating “climate normals” is done on a station-by-station basis. The values are not integrated – as part of this process – into regional or global values. That’s a different process, with different needs and complications.
For the 1991-2020 normals, there is going to be a lot of work in some parts of the world to to handle the shift from almost-entirely-manual measurements to automated weather stations. I know that the decision in Canada in 2010 was there were enough stations with manual measurements, and the automated stations were new (short records), so the normals used the manual measurements. As of 2020, there are so few stations using manual measurements – the only choice will be to included automatic stations. Few automatic stations have 30 years of records, so there will need to be a process of merging the two types of data at the same location. I”m sure Victor is familiar with the complications that involves. 🙂
ATTP: Yes, exactly
Well, Victor dug deeper than I did. I knew the WMO climate normals went back a long time.
I did a 3-minute Google search and found records going back to the 1931-1960 period.I didn’t bother looking further. What sort of academic writes a paper that makes assumptions that are falsified by a 3-minute Google search? (I know. No need to answer that.)
Citing the Wiki is usually frowned upon in academic papers. No need to reinvent the wheel. The same should apply to a paper can be refuted by the very first paragraph from a Wiki entry:
https://en.wikipedia.org/wiki/Climate
There is absolutely no need for our favorite Climateball geographer to go full POMO for a mere slippery slope.
“I”m sure Victor is familiar with the complications that involves.”
I am not involved myself, but colleagues have been given talks for the last 3 to 4 years on how they are preparing for the new climate normals. All data being digital makes it relatively easy nowadays, but it is still a lot of work. Selecting good quality stations, coordinating with neighbouring countries for comparison stations around the borders, quality control (normal QC for weather prediction only uses data from the past, for climate work we also have values in the future), homogenization, mapping, data publishing, analysis.
Hulme: “The adoption of particular baselines and tolerances is an overtly political process with geopolitical, ethical and technological consequence”
It is sad that after politicizing climate change and creating mobs with conflicting theories to attack scientists because people do not think their actual objections against mitigation are convincing, they now also start of politicize helping farmer, communities and businesses with information on the state of the climate.
” Climate will ‘change’, one might say, in an instant; the world’s climate will ‘suddenly’ become nearly 0.5°C warmer.”
only if you don’t understand baselines… (the climate hasn’t suddenly changed, a climatology perhaps, but not the climate).
I don’t think it is anything like changing the definition of a metre either – more like cutting exactly 1cm of one end of the standard and welding exactly 1cm onto the other end. The UTC thing is a much better analogy AFAICS, it doesn’t change the rate at which time passes, just an anomaly from a different reference point.
BTW I don’t recall the change in baseline for Arctic sea ice causing any significant communication problems. I suspect some climate skeptics will have made a fuss about it, but that doesn’t mean there actually is a significant sci comm issue.
If an argument depends on a particular choice of baseline, then that suggests it is a pretty feeble argument, and it is so easy to change the baseline for a time-series it isn’t clear what the problem is, provided the baseline used is reasonable and clearly indicated?
Dikran,
I think this is an illustration why some have issues with some of what goes on in STS. Take something that most scientists would regard as a straightforward technical adjustment. Write a convoluted paper suggesting that it has social and geopolitical implications. Then suggest that science is a social construct. Rinse, repeat. Etc.
Indeed. STS criticism of sci-comm also seems a bit ironic with sentences like “Climatic normals and baselines give precise form to the metaphysical notion of climate as an idea that imposes a degree of imaginative order upon the human experience of atmospheric chaos (Hulme, 2016).”. I realise that is probably understandable for the regular readers of the journal, but looks pretty opaque to me. I gave it quite a bit of thought, but as far as I can see it is just saying that normals and baselines give you a concrete method of expressing changes in climate in a way that can be easily comprehended. But that is just a statement of the bleedin’ obvious, so presumably I am missing something.
Also while the atmosphere is chaotic, I am not convinced that climate is chaotic, and I am not sure I am missing some point there, or whether it is just poetic/rhetorical hyperbole.
I should also say that baselines and normals are not used to to order human experience of anything. They are statistical tools for describing reality, not our experience of that reality. My watch tells me that The Midnight Sky was shorter than the Ballad of Buster Scruggs (the next film I watched) but my experience was very different! ;o)
Dikran,
Yes, I read that sentence too and just thought “what are you talking about??”
relieved it wasn’t just me then! ;o)
Building off Dikran’s comment. Many struggle with separating weather from climate. Weather is chaotic, so climate must be chaotic right? I don’t see any evidence that climate is chaotic. If a big volcano erupts and knocks the earth off its climate trajectory, does it jump to a new trajectory? No it slowly returns to the path it was on. Appears to be a very stable system in the absence of change.
But what about today, climate is changing rapidly, a 30-year climate “normal” conveys a certain expectation about our present and near-future climate that doesn’t match reality. That is the public disorientation that I worry about.
Chubbs,
One of the best discussions I saw about this, was Isaac Held in this document that I wrote about in this post. Essentially saying something similar to what you’re saying. Just because the internal dynamics of a system are chaotic doesn’t mean that the overall behaviour of that system is chaotic. A double pendulum isn’t going to, by itself, suddenly leap into the air and fall off the table.
… and if you put an electromagnet to one side, the distribution of the angles of the joints in the (steel) pendulum will change in a quite predictable manner as a function of the current…
Yes, 30-years gets rid of most of the noise, still need to account for the dial being turned.
Back in the day I started writing a java applet with (multiple) double pendul{a,ums} and a graph that you could use to plot the current (forcing) to demonstrate how Monte-Carlo climate simulations worked, but it would need to be javascripted now. You can’t predict the exact path of the pendulum, but you can predict the change in “pendulum states” (c.f. Lindzen Prager U. misinformation video).
Chubbs: “Yes, 30-years gets rid of most of the noise, still need to account for the dial being turned.”
Because it started in times with a more or less stable climate people have estimate the current state of the climate as an average over the past. But you are right that it may be a good idea to update out methods: to estimate the current climate a local linear regression may be more appropriate.
Wait until Mike reads about real cluster concepts, e.g.:
https://www.brookings.edu/research/defining-the-middle-class-cash-credentials-or-culture/
Each of these types of definitions can be operationalized differently, for instance:
As one can see, that has nothing to do with changing a climate baseline.
ATTP,
Thanks for the links, good to reread. Thinking back to our predictability donnybrooks. I have come to appreciate the turbulent eddies. The faster information is lost on a shorter weather scale, the faster it can be obtained on a longer climate time scale. In there was memory of the La Nina we had 20 years ago or the weather system from last year, climate prediction would be more difficult.
I read this version …
Climates Multiple: Three Baselines, Two Tolerances, One Normal, Zero Mountains and Minus One Molehill
Click to access 2020-Hulme-climates-multiple.pdf
Catchy title if it had “Zero something” in its original title. I can see complaining about the 1.5C and 2C tolerances per the PACC. Complaining about baselines or normal relative to said baselines is just not a sound argument, sort of like saying people can’t figure out how a four function calculator works. Horizontal lines are changing … A-I-E-E-E-E-E-E-E …
“Complaining about baselines or normal relative to said baselines is just not a sound argument”
One sometimes wonders whether the main aim of these activists is to drive scientists crazy.
Or as our friendly host would say: we need a better quality of “sceptics”.
How does ITCZ position affect prognosis?
https://phys.org/news/2021-01-climate-position-earth-tropical-belt.html
Surprise to me.
My position on this is that it is Ok as well.
I do not mind where we set a baseline as long as it is scrupulously kept.
30 years is standard, a bit short for climate but then one can always compare the30 year blocks.
An added bonus of having a higher baseline is that if the temperature rise has been due to other natural causes any downturn will throw up negative values for the next 30 years!
–
Now of course this cannot happen, can it?
2021 will be a good year for skeptics.
David,
I thought that the expansion cells was a relatively well understand consequence of global warming, and that this would then influence the tropical zones.
Mike Hulme’s article has (predictably) confused the clowns at WUWT. To his credit, Watts himself pointed out the same problem (ie. higher baseline means lower anomalies) but it’s entertaining to read the comments and see the numberless ways people can misunderstand even very simple things. Furthermore, they are confused now whether they should hate Hulme or not.
nyolci,
Thanks. I’m impressed that Anthony worked that out (although, I think he had to check with Roy Spencer). It’s not that long ago that he was very confused about temperature anomalies.
It’s not difficult to get these things the wrong way round – believe me! ;o)
The baseline is warmer, the anomalies are cooler, but who looks at the baseline temperature?
I like Anthony’s absolute temperature plot though
Very “DenialDepot” ;o)
“The only temperature plot that isn’t a slave to baseline choices is absolute temperature.”
[plots data using temperature scale set by baselines at “the freezing temperature of a solution of brine made from a mixture of water, ice, and ammonium chloride … [and a] … best estimate of the average human body temperature”]
had the Rankine scale been used instead, the graph would look exactly the same, except the actual values would differ by an additive constant, which is precisely the difference between two anomalies of the same temperature data with different baselines.
Probably shouldn’t have looked. It seems that WUWT still can’t even accept that the rise in atmospheric CO2 is due to anthropogenic carbon emissions (www). Had a quick look at he book, as usual confusing the fate of individual carbon dioxide molecules with the fate of an excess of atmospheric carbon.
angech –
> 2021 will be a good year for skeptics
Your statement is meaningless, I’d guess because you seem to fundamentally misunderstand “skeptics.” Every year, by definition, is a good year for “skeptics.”
Don’t believe me?
Find one year since it’s inception that WUWT (or for that matter Climate Etc. after maybe one or two years in) wasn’t filled day after day with articles “proving” that “skeptics” are right.
My guess is that if you did a quantitative analysis, you wouldn’t find any one year is different from any other in that regard (%-wise if not in terms of absolute numbers) . It matters not what the climate is actually doing.
Joshua,
slow down.
“Every year, by definition, is a good year for “skeptics.”
That is your definition.
Not everyone’s.
“ It matters not what the climate is actually doing.“
Well, actually it does.
All the time.
If a year is warmer, that is bad for skeptics, by everyone’s definition.
If it is cooler, that is a good year for skeptics of AGW.
Mind you, 2 years is better and 10 years is bliss.
My feeling, backed up by JIm Hansen, is that 2021 will be a cooler year.
Does that prove skeptics right?
Not at all.
Impossible for many scientific reasons.
But they will be a happier little bunch this year for sure.
Angech, Joshua is right. On years where there has been cooling (regardless of the reason) skeptics can claim that it is good for them. On years where it warms they just make baseless claims that it will cool next year, which is essentially what you have just done.
after
Of course you can prove Joshua wrong by providing URLs for skeptic blog articles that suggest observations suggest that the skeptic position is wrong.
Skepticism sadly has very little to do with science, if it were they wouldn’t *still* be promulgating arguments that the rise in CO2 is natural – but they are.
” My feeling, backed up by JIm Hansen, is that 2021 will be a cooler year.”
verifiable reference please.
Regression to the mean tells us that this year is likely to be somewhat cooler than last year (all things being otherwise equal), but that is just a statement about the noise – it tells you precisely nothing about the underlying trend, nor does it provide evidence to support the skeptic position. Similarly any dip due to ENSO is also just “weather noise”, so if you want to make arguments about the underlying trend, you need to account for ENSO, as Foster and Rahmstorf did back in 2011.
https://iopscience.iop.org/article/10.1088/1748-9326/6/4/044022/meta
angech,
None of this is really good for anyone.
In the quote from the email discussion between Anthony Watts and Roy Spencer, it does sort of emphasize that there may be a sci-comm issue:
I think this is conflating the jargon meaning of “climate normal” and the everyday meaning “usual” or “expected”. I don’t think climatologists are using normal to mean “expected”, but as defining a standard for comparison. If expressions like “above normal” are used in communicating climate to a general audience, then it will be a good idea to say how “normal” is defined (or perhaps avoid the expression)?
Dikran,
I’ve certainly seen examples (Ryan Maue might be one) where someone was highlighting how, for example, sea surface temperatures were only a few tenths of a C above normal, without making clear that the normal was something like a 1981-2010 baseline. So, it can be an issue if people don’t make clear what baseline they’re using, but I agree that “normal” here has a definition that isn’t necessarily the same as “this is normal”.
yes “x degrees C above the 1981-2010 average” is much harder to misconstrue (if not very Twitter-friendly ;o). I often find in discussing machine learning/AI it can be difficult that different sets of terminology are used depending on the direction you have approached it (e.g from electronics, computer science, maths, stats or physics) and it is hard to drop jargon terms even when speaking in a scientific context where you know there are problems with jargon. I can see how it could be a problem in sci-comm for a general audience as well. Perhaps it is a good thing that we have sci-comm people talking about climate that are not themselves climatologists and are bridging a vocabulary divide?
dikranmarsupial
> It seems that WUWT still can’t even accept that the rise in atmospheric CO2
It seems that WUWT is completely inconsistent in almost everything 🙂 sometimes the same idiot accepts something (like there IS warming), sometimes rejects (“Oh no, look at this graph! This is cooling!” And shows “the artifact of his method”). They are consistently inconsistent. The funniest thing is when they presume a conspiracy for getting rid of the Medieval Warm Period (or the various Warm Periods). I ask them, hey, guys, how do you know about the “Minoan Warm Period”? Is it like Homer or Plato was talking about this? Or because of the very reconstructions you hate so much like Mann’s? Now please decide you accept science or reject! 🙂
Angech could be right. Parler closed down. Trump will leave office today disgraced by his coup attempt. People may leave their Qanon telegram groups, 8chan forums and GAB microblogging platforms and return to WUWT & Co.
A little later the people who see spreading misinformation on Corona and vaccines as a more effective way to kill other people with impunity may return home.
2021 could be a good year for climate “sceptics”, where ad revenue and crowdfunding for the producers of their lies jump up.
DM [from Moyhu blog]
“Global Temperature in 2020 14 January 2021 James Hansena, Makiko Satoa,Reto Ruedyb,c, Gavin Schmidtc, Ken Lob,c,Michael Hendricksonb,c Abstract.Global surface temperature in 2020 was in a virtual dead-heat with 2016 for warmest year in the period of instrumental data in the Goddard Institute for Space Studies (GISS) analysis.The rate of global warming has accelerated in the past several years.The 2020 global temperature was+1.3°C (~2.3°F) warmer than in the1880-1920 base period; global temperature in that base period is a reasonable estimate of‘pre-industrial’ temperature.The six warmest years in the GISS record all occur in the past six years, and the 10 warmest years are all in the 21st century.Growth rates of the greenhouse gases driving global warming are increasing, not declining.”
In the article he states ,
“Observed global temperature over the next year or two will help inform us whether the apparent acceleration of global warming is significant. The current La Niña (Figures 4 and 9) is moderately strong, so this year–2021 –should be notably cooler than 2020.”
The article backs up the opinions in ATTP’s article.
maybe a good time to re-open the Open Atmospheric Society? ;o)
angech, Hansen explicitly says that the reason 2021 is expected to be cooler is ENSO, so it provides no support *whatsoever* for the climate skeptic position. I pointed that out to you in my previous post.
so what was the next sentence in Hansen et al’s note?
plus ca change, plus c’est la meme chose…
angech –
It would be one thing to first day a cooler year would be good for everyone and then to clarify it would also be good for “skeptics.”
But going from saying a cooler good year for “skeptics” and then after being called in thst saying a cooler year for everyone comes across to me as disingenuous.
But regardless – a year of (relatively) cooler temps, let alone cooler temps along one metric that ignores aspects such as ocean heat content, is not terribly relevant. And you know that.
angech –
> If a year is warmer, that is bad for skeptics, by everyone’s definition.
I have to say, if I could pick one ridiculous comment for you to make to illustrate the fallacious rhetoric of online climate “skeptics,” that might be it.
One year is effectively irrelevant, scientifically (unless it were totally anomalous in a way we know it won’t be). But you would want to make one year relevant. And if you took time to think you must certainly know how facile that is, but you do it anyway.
It’s not because you’re a bad person – but because you’re coming at the discussion from a rhetorical framing rather than as a scientific discussion. That you would come here, to a place where people might engage you with the science meaningfully if you chose to have that discussion, is rather unfortunate.
Joshua,
Not that I want to move the discussion over here, I have been observing your interactions with DPY on climate etc. Fascinating.
Anders –
Yeah. It’s quite something. Not really more that can be said other than that.
Well, as the WMO’s so called ‘mandate’ is their new normal baseline, somehow, don’t ask me how or why, I don’t expect GISS, HadCRUT, NOAAm RSS or BEST to change their baselines …

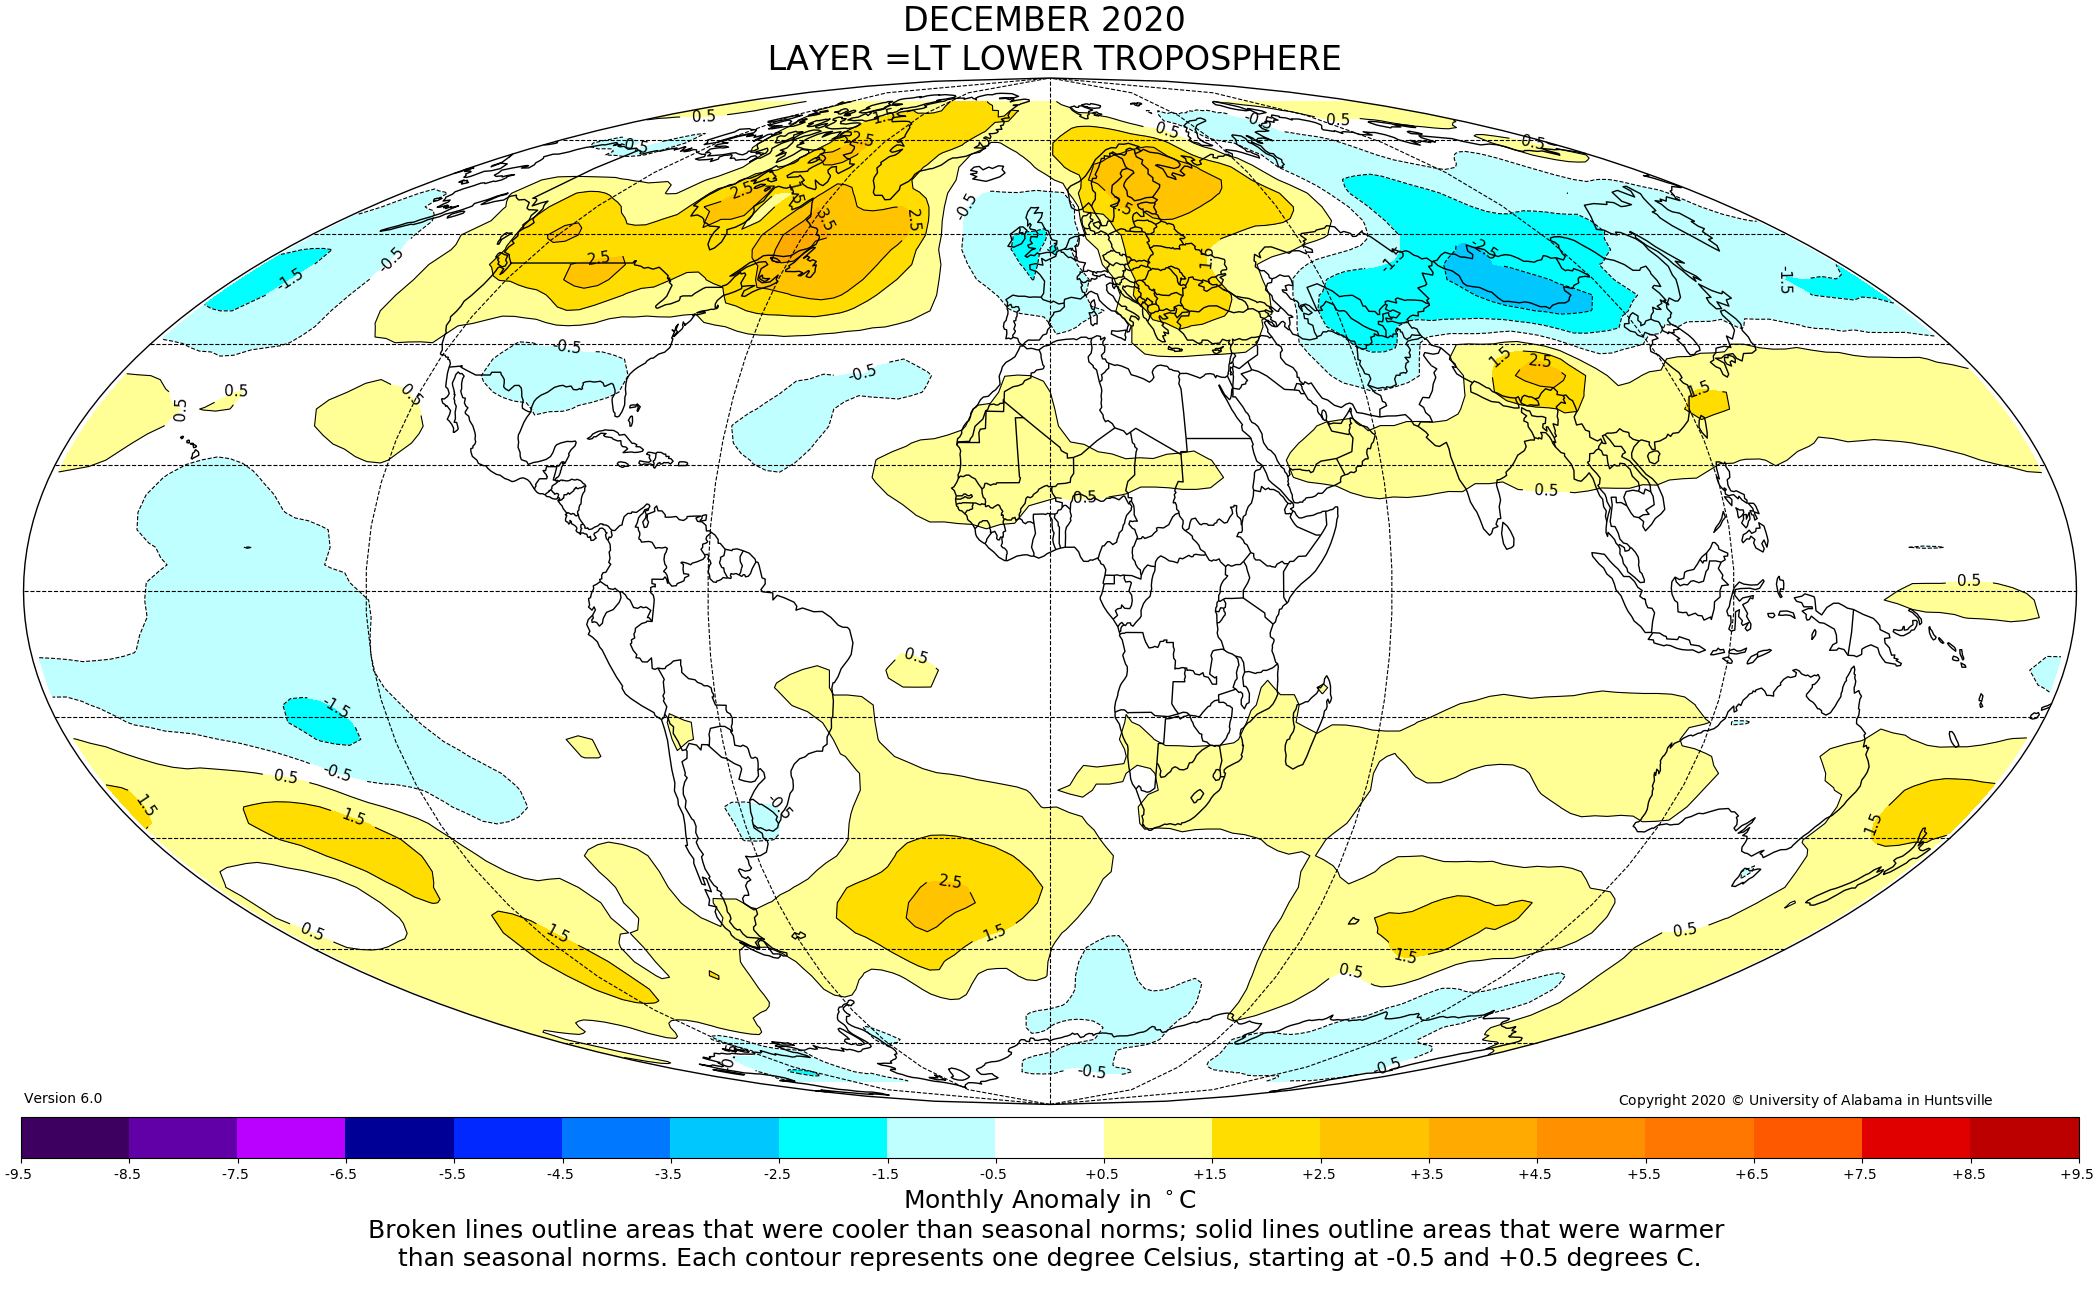
Expect to see bluer maps from UAH though …
Their baseline is 1981-2010 (not shown on graphic). Expect to see their new baseline of 1991-2020 in Climates MultipLIED: Three Baselines, Two Tolerances, One Normal and Zero Credibility
I suspect those maps would look pretty much the same whatever baseline you chose. All that would change is the numbers on the legend at the bottom. That is because the software most probably puts in a given number of contours, or puts them at regular pre-specified intervals that wouldn’t depend on the baseline.
or maybe not…
Speaking at quite something:
A while back, angech informed me that Nic was definitely right when he said 8 months ago that Sweden had crossed a herd immunity threshold.
Also quite something – commenters posting at Judith’s’ with videos making the case that Bill Gates is leading a conspiracy to use the pandemic to limit freedoms. And Judith is deleting my comments where I mildly make fun of them for doing so.
I forgot to add that Judith deleted my comments making fun of the conspiracy-mongers on a thread about how removing comments (and commenters) from social media is tyrannical censorship
my irony-o-meter has imploded by proxy ;o)
Joshua,
Remember what dpy sez …
“Why would anyone with scientific credentials even take the time to read your truly vacuous statements?”
To which I replied something to the effect … “That is why we have you David, Boom! Rimshot.”
That comment was cancelled a day or two later.
dpy should be rather famous by now. as I have never seen so many appeal to authority fallacies by any one individual ever before.
The Biden threads were rather fun though, I must admit.
“A while back, angech informed me that Nic was definitely right when he said 8 months ago that Sweden had crossed a herd immunity threshold.”
I guess the second wave they are having rather suggests that might not be the case… 😦
ATTP: Fodder for a new OP…
Refining the remaining 1.5C ‘carbon budget’, Guest Post by Dr Kasia Tokarska & Dr Damon Matthews, Carbon Brief, Jan 19, 2021
On the “good news” front…
Biden’s First Climate Actions Include Rejoining Paris Agreement by Scott Waldman, E&E News/Scientific American, Jan 20, 2021
DM
“plus ca change, plus c’est la meme chose”…
I like it. I might even use it as a motto.
–
Very appropriate on many levels.
I wish it applied to Climate change as well.
–
Thank you.
September methane levels are out and unless 2020 is a strange one-off anomaly we are seeing an abrupt increase in the rate of rise. methanelevels.org, select the last ten years. And appreciate we have two more months of growth.
“I like it. I might even use it as a motto.”
I don’t, and don’t think you should. I was pointing out that you were still misrepresenting your sources, just as you have been for a very long time. Science requires we be honest in representing sources and that we acknowledge arguments rather than ignore them (e.g. downturns due to ENSO do not in any way support the climate skeptic position).
Plus ca change is not a good thing for a human being. We all ought to be works in progress, no matter how old we are (though some of us are in more need of progress than others).
[But Alarmism. – W]
There are some obsessed with the supposed increase of 338 ppm to 410 ppm of CO₂ and I hope that this information will help the alarmist to sleep better at nights.
A part per million is like 1 drop of ink in a large
kitchen sink.
A large kitchen sink is about 13-14 gallons. There
are 100 drops in one teaspoon, and 768 teaspoons
per gallon.
Some other things that are one part per million are…
One drop in the fuel tank of a mid-sized car
One inch in 16 miles
About one minute in two years
One car in a line of bumper-to-bumper traffic from Cleveland to San Francisco.
One penny in $10,000.
I know that you understand that these 72 additional ppm are spread out over this 16 miles in different one inch segments and wouldn’t it be a task to be told to sort out the 410 pennies from the number that it would take to make up $10,000.
At 410 parts per million CO₂ is a minor constituent of earth’s atmosphere– less than 4/100ths of 1% of all gases present. Compared to former geologic times, earth’s current atmosphere is CO₂ impoverished.
Let’s picture this in another way to really get an idea of the scale of CO₂ compared to the total atmosphere. The Eiffel Tower in Paris is 324 meters high (1063ft). If the height of the Eiffel Tower represented the total size of the atmosphere then the natural level of CO₂ would be 8.75 centimeters of that height (3.4 inches) and the amount added by humans up until today would be an extra 3.76 centimeters (1.5 inches)
John,
That’s just silly. You’re arguing that because you can make it sound like a small number, the effect will be small. That’s just a fallacy. CO2 is the dominant non-precipitating greenhouse gas. The reason we have a climate that is so suitable for life is largely because of CO2. If we double atmospheric CO2 the change in forcing is about 3.7 W/m^2. That, by itself, would warm the surface by just over 1K. Feedbacks are almost certainly positive and mean that the net effect of doubling atmospheric CO2 would probably be to increase surface temperatures by between 2K and 4.5K, with a best estimate of around 3K.
Of course, how much we eventually warm will depend on how much we change atmospheric CO2 concentrations, which depends on how much we emit. Current trajectories suggest we are heading towards emitting enough to increase surface temperartures by about 3K, with uncertainties meaning this could be as low as 2K, or as high as 4K, or higher. The differencein global surface temperatures between a glacial and an inter-glacial is around 4-5K. So, we can change the surface temperature by an amount that is similar to the difference between the temperature when parts of North America and Europe are covered in mile-high ice sheets and today, when we only have ice sheets in Greenland and the Antarctic.
You can, of course, decide that a warming of that magnitude will somehow have little effect. Many others disagree and would rather we didn’t actually find out.
I wouldn’t want one part per million of botulinum toxin in my bloodstream.
There is a very good reason why even a very small concentration of CO2 can have a substantial effect. The flux of energy we receive from the sun is VAST and for the Earth’s temperature to remain stable, the amount of energy it radiates back out into space must be equally VAST. Even a small proportional change in the outbound flux, due to increasing GHGs, is a very large amount of energy indeed in absolute terms. If we keep accumulating that imbalance (small in relative terms as it may be), the planet will warm. The amount by which it warm depends on the absolute magnitude of the imbalance, not the fraction of inbound energy from the sun.
“Compared to former geologic times, earth’s current atmosphere is CO₂ impoverished.” yes, bit of a paradox, isn’t it*?
* actually, … no.
John Swallow – I can recommend looking through the list of most commonly encountered climate myths here: skepticalscience.com/argument.php. Oddly enough, we have heard of most of these canards before (more than once), so it would be good to be aware of what the responses are likely to be beforehand.
See particularly #2, #30, #39, #44, #51 and #76
A drop of black ink in a sink is quite noticeable. One wonders what skeptics are thinking. Like they are the only ones who can figure out what a part per million is.
Dan Miller has debunked this nonsense with INK
why don’t deniers ever do any experiments
dikran: But that is just a statement of the bleedin’ obvious, so presumably I am missing something.
I think Sokal would say that sort of literature is divided into two categories: provably wrong, and statements of the bleedin’ obvious.
Oh, no. John Swallow has escaped from RealCimate, where he has recently been spouting all sorts of shite (as J. Doug Swallow). He’s been through Skeptical Science in the past (also as J Doug Swallow). The Dunning-Kruger is strong in this one. There is little point in feeding his fantasies.
Dave_Geologist ;o)
The Sokal reference reminds me that a lot of STS stuff seems to be written in the linguistic equivalent of “proof by cumbersome notation” used in mathematics.
Actually dikran, now I cast my mind back I think his original point was that the language was so opaque the same claim was open to two interpretations: provably wrong, or a statement of the bleedin’ obvious.
I think that is very well demonstrated by the “Sokal affair”, if the style of writing was plainer, it would have been easier to see that it was nonsense, rather than giving it the benefit of the doubt. On a similar note, I have difficulty believing that Bruno Latour’s account of Einstein’s twin paradox wasn’t meant as a similar sort of joke. It’s not easy being an engineer! ;o)
[Mod: Sorry, Doug, as fun as it is to whack-a-mole, it does get tedious after a while. If you’ve spent time at Realclimate and Skeptical Science and still promote these climate myths, it’s unlikely that I’m going to have any more success than they did in convincing you of your errors.]
Pingback: Alan’s Bottle | …and Then There's Physics
Good to see the new 30 year baseline now at Roy Spencer as well!
It will make the current temperature increase look small and make potential future drops look massive.
An added feature is the apparent drop to a negative month in late 2018?
Already working!
angech,
That doesn’t really make any sense. The baseline doesn’t influence the rate of warming, or cooling. Plus, there are multiple baselines. Present day allows us to provide information about likely present day conditions. Pre-industrial tells us how much we’ve warmed since then. Etc.
Angech say the temperature yesterday was 40F and today is is 42F, an increase of 2F. If I were to use a different baseline, by using the Rankine scale (which is same as the Farenheit system, but shifted down so that zero was at absolute zero, i.e. 0 Kelvin), then yesterday it would have been 499.67R and today would be 501.67R, the difference would still be an increase of 2R (which is exactly the same magnitude of change as 2F). Changing the baseline has no effect whatsoever on the representation of increases or trends.
I said Roy, et. el. would do so … above …
“Their baseline is 1981-2010 (not shown on graphic). Expect to see their new baseline of 1991-2020 in Climates MultipLIED: Three Baselines, Two Tolerances, One Normal and Zero Credibility”
I do not expect to see the others change their baselines though. I also said so but we shall see (blue = below absolute zero and red = hotter than the hottest object in the universe).
“angech, That doesn’t really make any sense. The baseline doesn’t influence the rate of warming, or cooling.”
–
Correct.
My comment was to how the temperature anomaly would look to anyone looking at the graphs.
While the trend and anomaly changes are the same putting them on a graph with a new higher baseline means that the overall appearance [not the actual change], compared to the old lower baseline is of lower [smaller] positive anomalies.
For example the December UAH reading was an anomaly of perhaps 0.27 C degrees but on this months graph it changes to 0.15 C.
The effect is that it appears as if there is less warming, even though the amount of temperature change has not shifted at all.
Less of it appears above the line.
A seeming 0.12 C decrease in the anomalies for 30 years despite the trend being the same.
This cannot be good.
“While the trend and anomaly changes are the same ”
“The effect is that it appears as if there is less warming,”
“warming” implies a change in the anomaly or a trend, which you have just said is still the same.
“The effect is that it appears less warm” might be a more accurate description, but even that is wrong.
It is 3C here in Norfolk at the moment, if I said it was 276.15K it may *appear* warmer described like that, but of course it isn’t, we have just measured it relative to a different baseline.
DM, while I appreciate your comment the point I am making is the appearance, not the actual trend.
If we are talking about the appearance if a baseline is drawn and the anomalies about it are of lower magnitude compared to that new elevated baseline then the anomalies appear smaller.
–
“The effect is that it appears less warm” is an accurate description.
I have not said it its less warm, ever. I am pointing out that changing a baseline, which does not change trends, can create an appearance that the world is colder, just the same as when you adjust it down it appears warmer.
–
“It is 3C here in Norfolk at the moment, if I said it was 276.15K it may *appear* warmer ”
We both know it is the same temperature but a 276.15 degree rise from a baseline certainly appears warmer than a 3 degrees rise.
–
Why not keep the older baseline or extend it and show what appears to be more warming?
This is the question a lot of people are asking [not skeptics by the way].
Oops
” the anomalies about it are of lower magnitude compared to that new elevated baseline then the anomalies appear smaller.”
Should read
” the anomalies about it are of lower magnitude compared to that OLD elevated baseline then the anomalies appear smaller.”
angech,
The reason you change the baseline is because there are reasons to want to define typical conditions in present-day climate. Given climate change, this is changing with time. Hence, you need to update the present-day baseline.
Thanks ATTP.
Understood.