
Eli’s recent post about Black swans, and black cats, motivated me to look into what the whole Black Swan idea was all about. As I understand it, a Black Swan event is simply an unexpected event, that has a significant impact, and that – in retrospect – we regard as something that could have been predicted. Unless there’s some subtlety that I’m missing, this essentially seems to be equivalent to the uncertainty isn’t our friend and high risk, low probability events arguments that have been made in relation to climate change before.
In Eli’s post he touched on Nic Lewis’s Energy Balance approach, and I thought I might expand on this a bit here. Many people seem to use the basic energy balance calculations to argue that climate sensitivity is probably low and that climate models are over-estimating climate sensitivity. The energy balance approach is fairly simple: the transient climate response (TCR) can be estimated using
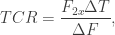
and the equilibrium climate sensitivity (ECS) can be estimated using
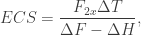
where 


If you carry out an energy balance-type calculation (see, for example Otto et al. 2013 and Lewis & Curry 2014) you do indeed find that the best estimates for climate sensitivity are lower than many other method would suggest, and the range is also shifted to lower values. A number of people are therefore using these results to argue that climate sensitivity is probably lower than previously thought, and that climate models are over-estimating climate sensitivity.
However, there is something that should be borne in mind when making such claims; energy balance models have a number of assumptions which – in my experience – are rarely acknowledged.
- Feedbacks are linear: There is a fundamental assumptions that the feedback response is linear; the feedback response in the future will be the same as it has been over the interval considered by the energy balance calculation.
- Polar amplification is negligible: A number of the temperature datasets suffer from coverage bias and may be underestimating the temperature change through not including sufficient coverage of the Arctic where warming may have been faster than the global average. One can compensate for this assumption by using a temperature dataset that tries to account for this coverage bias (Cowtan & Way, for example) but I don’t think any published estimates have done so.
- Internal variability is negligible: Given that energy balance models assume that the observed temperature change is all externally forced, they’re essentially assuming that internal variability has had no effect.
- Forcings are homgeneous: The forcings are assumed to be globally homogeneous. Given that there is more land mass in the northern hemisphere than the southern hemisphere, the north should warm faster than the south. Any inhomogeneity in the forcings, could therefore influence the global estimates.
So, given these assumptions, I don’t think one can really argue that energy balance calculations suggest that climate models are over-estimating climate sensitivity. They might be, but all I think one can say is that if the above assumptions are true, then energy balance calculations suggest that climate sensitivity might be lower than other estimates suggest. In fact, one might argue that all the above assumptions are probably wrong to some degree or another and that some could change the estimates by 5-10%. If so, it’s hard to really argue that energy balance estimates are evidence against the higher climate sensitivities that other methods suggest might be likely. I think it is this kind of issue that leads Nasim Taleb to say
Skepticism about climate models should lead to more precautionary policies in the presence of ruin. It is incoherent to doubt the mean while reducing the variance.
Maybe I’ve misunderstood the whole Black Swan idea, but it does seem that climate change could be ripe for a Black Swan event. Given how hard and how fast we’re pushing our climate, it wouldn’t be particularly surprising if something unexpected were to happen. Could it be something good? Possibly, but I think the parameter space for unexpected events having a damaging impact is significantly greater than the parameter space that would allow for positive impacts. Of course, if something were to happen, it would probably be followed by some people saying “we didn’t see that coming”, immediately followed by others responding with “we did!”

It was reading NNTaleb’s book, ‘Black Swan’, that took me from ‘concerned’ to ‘very concerned’ at what climate change might have in store for us. History is littered with these events which often in hindsight seem predictable but which people seem to think won’t happen because they’ve never happened before. As you say it’s ripe for a black swan event, though I’d go further and say it could be the the biggest black swan since the large dinosaurs were wiped out.
Taleb gives the example of 9/11. What would have happened if, in the weeks leading up to it, a security specialist somewhere had thought, ” it’s too easy for a passenger to enter the cockpit of a plane during flight and take over, so from now on we’ll take the precaution of making it mandatory for all cockpit doors to be locked in flight”? Clearly 9/11 would just never have occurred. In fact many improvements in the safety of flight are as a result of lessons being learned the hard way, even though almost all of those should have been expected beforehand and perhaps prevented with such a simple procedural change as locking the cockpit door. Or like paying 1$ per flying hour to remote monitor the positions of all planes by INMARSAT; which would prevent a co-occurrence of a mystery like MH370.
So, coming back to climate; it seems clear to me that however remote the possibility of a (currently undiscovered) climate tipping point occurring somewhere down the line—especially given the potential for the result to turn into a global catastrophe—it really isn’t a risk any supposedly civilised society should be willing to take. Uncertainty is definitely not our friend when it comes to this issue.
Engineers will struggle mightily to ensure their systems stay well within the “operating curve” of near linear responses. Outside these zones lies intractable mathematics and real world disasters.
We seem to be struggling mightily to probe the non-linearities.
Mike Rampino has just floated the Mother of All Internal Variability Wild Cards
Calling Captain Hindsight:
https://en.wikipedia.org/wiki/Coon_2:_Hindsight
So, after it happens, humanity reasons, in hindsight, as always, saying, we should have known that. That this happens with p =1 is no surprise, after all, hindsight explains 100% after the fact, it’s circular logic, but who cares.
As to the IPCC, ECS is 1.5C to 4.5C (66% (or 68%) confidence interval), of course we’ll never see it, as climate is a moving target. But, you say, these go to 11. And before you know it, Lewandowsky (who is NOT a coastal engineer or even a climate scientist), is telling you to build those coastal protective structures, right NOW, to +80m even, and by three days before The Day After Tomorrow, no less … Stark Raving Sargent.
Desk jockey’s of thought, where’s boots-on-the-ground logic when you need it?
Fat tail to infinity my ass!
http://exploringpossibilityspace.blogspot.com/2013/07/think-you-understand-black-swans-think.html
Most people state it more simply … as … shit happens!
I once saw a black squirrel, haven’t seen one since, or before that one incident.
If I saw something that I’d never seen before what would I do? Nothing.
I’ve been following Taleb with interest for a very long time. See for example this conversation with Daniel Kahnemann from 2009:
Consequently it gave me much pleasure to quote this section:
Skepticism about climate models should lead to more precautionary policies.
from this paper of his (more about GMOs than climate in fact):
Click to access pp2.pdf
over at Judy Curry’s recently!
The thing about black swans is that they are by definition unprecedented. Therefore, we cannot estimate their probability other than to say that it is probably low. The low probability coupled with the severe consequences make for high uncertainty in the risk.
I can also highly recommend reading one of the books of Taleb. They are an eye opener and entertaining. One is probably enough, they are all similar. Maybe the last one, he claims he keeps on refining his ideas.
A black swan is a bit more than just uncertainty is not your friend. Central is the idea of thick tail distributions, where an enormous outlier is much more likely than one would have thought from the experience people have with variability. Or maybe one should write more like than an academically trained person would think who is indoctrinated during his studies with the normal distribution.
If the variance is finite and many things contribute the normal distribution is a good assumption. However also the variance varies, it may not be finite (for practical purposes). In an ever more connected world single events become important.
Taleb’s advice is to design systems and the organise your life in a way that surprises have an upside, rather than a downside.
When the nuclear power plant in Chernobyl exploded people commented: who would have thought the operators would make experiments. When Germany got out of nuclear power when Fukushima exploded people commented: but Germany does not have tsunamis. Ignoring that the next explosion will again be in a way we did not think of. Or did not want to think of: most nuclear power plants are not protected against aircrafts flying into them.
One can compensate for this assumption by using a temperature dataset that tries to account for this coverage bias (Cowtan & Way, for example) but I don’t think any published estimates have done so.
The time series to fit the statistical model on would be very short for C&W. That would probably be a problem.
Victor,
Yes, I’ve just been reading this and am starting to understand that subtlety.
Yes, that’s a point. Don’t some of the other datasets (BEST, GISS) have better Arctic coverage than HadCRUT though?
Anders, rather than assuming that internal variability is negligible, the energy balance models assume that the change in outgoing flux due to temperature changes resulting from internal variability match those due to temperature changes due to response to a forcing. For short term variability (eg, ENSO), that in turn assumes that all feedbacks respond fully to a change in temperature in at most one to two years. In the case of the ice albedo feedback, that is patently absurd.
You could argue that energy balance models assume the disjunction of the equivalent response or negligible variability conditions, in that the energy balance models would be accurate if either condition was satisfied ceterus paribus. However, certainly in the case of Judith Curry, and probably in the case of Nic Lewis, the assumption of negligible internal variability contradicts their views on the topic.
Jim Hunt –
Started watching that clip of Kaleb and Kahnemann.
It’s interesting, because part way through it – I could think that the implication of what he was saying was that we should focus on adaptation as precautionary policies.
Still – overall I’m not clear how to apply the discussion they had to the issue of climate change.
Any more thoughts?
I was going to respond earlier, but I decided it would be best to read Lewis & Curry 2014 before responding. I’ll start by addressing the 4 bolded assumptions that you mentioned:
“Feedbacks are linear”
I would argue that the assumption that the feedback responds roughly linearly to changes in forcing is reasonable if one is looking at empirical data over the last 1.5 centuries. Although if you want to get picky, the feedback probably decrease with magnitude of forcing since both the ECS and the ESS decrease with temperature (as I explained in the Pliocene-Pleistocene post).
What is the real problem though is the assumption of a roughly exponential response over time to a change in forcing in most of these time series models. This assumption leads to an underestimation of ECS. I highly recommend that people taking a time series approach to estimate climate sensitivity should adopt a methodology similar to Van Hateren 2012 in order to avoid underestimating climate sensitivity due to this false assumption.
“Polar Amplification is negligible”
I’m not sure polar amplification is necessarily being neglected when performing a time series approach, at least if a reasonable global temperature data is being used (such as HadCRUT4). The other thing to point out is that the the derivative of polar amplification with respect to temperature should drop (due to the gradual loss of the ice-albedo feedback and also since otherwise you would eventually have the poles warmer than the equator at some point).
“Internal variability is negligible”
I don’t see how Lewis & Curry are neglecting internal variability. They try to choose points in time with the same level of internal variability and choose time intervals that are relatively long. Also, the primary result of not taking into account internal variability for a time series analysis is to increase uncertainty, not to bias estimates. I agree though that attempts should be made to take into account internal variability (such as what Web Hubble Telescope was doing with his/her CSALT model).
“Forcings are Homogenous”
I don’t think that Lewis and Curry are ignoring this completely, or even Otto et al.. Lewis and Curry were treating Volcanic Aerosol forcing differently from GHG forcing for example (the effect of volcanic aerosol forcing was multiplied by a factor of 0.55). In any cause, you have a point that forcing inhomogeneity should be taken into account, at least to the extent that very different types forcings (GHG vs Solar vs Volcanic Aerosols) should be treated differently.
“So, given these assumptions, I don’t think one can really argue that energy balance calculations suggest that climate models are over-estimating climate sensitivity.”
I think one can argue this anyway based on their complete failure to predict the past decade. In any case, the climate models seem to consistently give climate sensitivity estimates that are generally higher than estimates that use instrumental data, which should be of concern.
One thing that you could have mentioned in the original post is that forcing from GHGs has been accelerating over the past century, where as most of these studies giving low estimates of ECS/TCR are often assuming a linear change in forcing over time (to be compatible with the TCR definition). Another thing not taken into account is that the past century has seen much less than a 1% increase in CO2 per decade, so most of these studies that do not take into account the difference between what actually happened and the definition of the TCR will generally underestimate the TCR and maybe the ECS as well. For example, I showed that the ECS in Loehle (2013) should really be ~2.95 C rather than 1.98 C due to precisely this issue.
I still think there is a lot of value in performing a time series approach to estimate climate sensitivity; it just has to be done properly (I think Van Hateren 2012 comes close to doing this). One thing that Lewis & Curry do really well is estimate their uncertainty, which is more difficult to do with GCMs, and often the GCMs are understating their uncertainty. Anyway, I’m trying to estimate climate sensitivity in my spare time using a mix of CSALT, Van Hateren, and other things. I’ll let you know if I get any decent results.
Also, this whole ‘black swan’ argument seems to be Pascal’s Wager to me.
The assumption that feedbacks respond fully for ice albedo feedbacks within a couple years is not absurd. It may be absurd if you meant ice sheet feedbacks. However for seasonal snow cover it seems to me quite likely to be true, and for sea ice effects I think its kind of reasonable but probably not perfect. I recall that William Connolly once did that study showing that if a large amount of sea ice was removed from the models artificially it was back within a couple years. I’d say that if the energy balance models are compared to dynamic models that exclude sea ice effects the comparison would be quite reasonable. On the other hand I can’t see any way that we could deduce from 20th century observations what a likely value for ice sheet albedo feedback would be as the amount of ice sheet lost so far is miniscule, and paleo observations seem to show that the amount of ice sheet eventually lost for the amount of Co2 emitted to date should be quite substantial.
And I do take comfort from energy balance models estimates that are a little lower than those of the models, and from the simple observation that over pretty much any period ending today and starting 10, 20 or 40 years ago the warming rate is a little lower than what is predicted. But that is a relatively thin comfort as the difference between energy balance or recent temperature trends and models isn’t all that great. Its not as if we can make any loud claims of ‘warming is only going to be 2.5 instead of 3 degrees – hooray we are saved (as long as we don’t get any nasty surprises)’. And some recent studies show that climate models that have the most accurate representation of cloud behaviour show high cloud feedbacks. I guess from the energy balance results and recent temperature history that the models with the most accurate representation of recent history show lower warming, and those with more accurate representation of clouds show higher warming. This suggests a disconnect and that somebody somewhere has left out something important. And until we know what is being left out how can we know if its the higher or the lower estimates that are right?
And of course energy balance models effectively assume that things will continue much as they have done so far. To me that is a reasonable assumption for doing interesting science on. But it also means that energy balance models cannot be used to rule out or in anyway reduce the chance of a black swan event as black swans simply do not exist in the assumptions of an energy balance model.
The majority of fat-tail distributions are simply due to having an uncertainty in the denominator, or as a consequence of a ratio distribution http://en.wikipedia.org/wiki/Ratio_distribution
Events that occur in such a fat-tail are known as Gray Swans according to Taleb.
Some of this is so simple that physics students likely learned it in their first college physics lab, where it is knows as “propagation of uncertainty”, and used to establish errors on inferred calculations from measurements. For example, v=x/t in speed measurements, and any uncertainty in time leads to a fat-tail in the estimated velocity.
Heaven forbid that an “expert” in uncertainty such as Judith Curry would ever discuss this on the CE blog !
I’ve taken ‘black swan’ like a very rare event, one that cannot be inferred from previous behavior by ways of statistics, and been using this sort of table to define it better: http://en.wikipedia.org/wiki/68%E2%80%9395%E2%80%9399.7_rule#Table_of_numerical_values
that is a database containing 370 datapoints would contain one normally distributed 3-sigma event, but wrt black swans, it cannot be assumed the normal distribution continues on rarer events, so if a 5-sigma event happens on the 371th measured data point this would be a black swan. so it would rather be a measure of how improbable an event is in respect to a model, rather than a general term of unlike occurrence. It’s like… setting the limits to Bayesian inference, I might say, but it’s fun on occasion to note the expected frequency of very improbable events, part of fun in statistics 😛
Not the clearest explanation I could come up with, but it’s 6AM here
-1,
I’m not convinced you’ve understood my point about the assumptions.
Depends what you mean by concern? My point would be that you can’t really use the simple energy balance estimates to claim model estimates are probably wrong. They might be, but the assumptions used in producing the energy balance estimates means that you can’t rule out that the climate model results. Additionally, the climate model results are also consistent with paleo estimates.
Tom,
Yes, but this would apply only to the ECS calculation, not to the TCR one, which would still be influenced by internal variability.
Good point. I knew I was forgetting something.
Michael Hauber,
Precisely.
Any talk of ‘Black Swan’ events is alarmists hyperbole.
Just an attempt to leverage the observed trends in the climate into a much more serious risk. The last 6000 years of human civilisational climate history make it evident that ‘black swan’ events are extremely improbable whatever arguments are made about ‘fat tails’. The results of economic research indicate that the lower level of warming indicated by energy balance models may be beneficial. (Tol et al)
A golden goose rather than a black swan may be more likely.
(sarc/off)
izen,
Someone remarked in 2008 that the most dangerous words in the world are “This time it’s different”. Economists around the world were extolling the strength of their local economies, and few foresaw the worst recession since the 1930s. Glorification of the coming Eden of climate change have the same ring to them.
Even the early versions of Tol et al, assuming we mean the same paper, showed that there was no temperature rise that would not damage developing economies, the very places from which 21st century economic and population growth is supposed to come.
That was alarming enough in itself, but the recent corrections to Tol’s paper show that is the case even for developed economies. http://rabett.blogspot.ie/2015/02/journal-of-economic-perspectives-editor.html
In my understanding the importance of black swan events is a combination of two things.
1) the fat tails
2) the very large number of ways something very surprising can take place.
The fat tail means essentially that something that’s not only exceptional, but far beyond the limits of ordinary has a probability that’s not virtually zero. With Gaussian distribution one more standard deviation from say 3σ to 4σ has a huge impact on the probability, with fat tails 5σ or 6σ sd may still have a non-negligible probability. That’s particularly true in light of my second point. When we include also very unlikely events, the total list of possible events grows much longer.
Each type of black swan is very unlikely, but occurrence of some black swan out of very long list of possible black swans is not that rare.
The typical reason for the long tails is the dominance of one effectively random cause. The Central Limit Theorem that leads to Gaussian distribution builds on the assumption that the final result is the combined effect of many additive actors, none of which is close to the resulting standard deviation. When a single cause is behind the outcome there’s absolutely no reason to expect Gaussian distribution (assuming that that single cause is genuinely the original cause and not built from smaller inputs).
Mandelbrot is the second (or first) well known name, who has discussed this kind of ideas in the spirit of popularized science. He emphasizes very strongly the ubiquitousness of power law tails, but my own feeling is that the power law has also been used beyond its limits of applicability, and that Mandelbrot has contributed to that.
The same issues are essential, when extreme weather events are discussed. My two points make it very difficult to analyze them properly even on the simplest level of answering, whether extreme events have increased or not. Some kind of exceptional weather is observed very often, because weather can be exceptional in very many different ways. When one of these possibilities has occurred people tend to pick the characteristics of that particular event and search for earlier occurrences. Those may have been rare. At the same time people do not notice that the earlier history is full of different kinds of extreme events that have not repeated lately.
Building unbiased statistics on the total count of extreme events is really difficult, because presenting an unbiased definition of what is an extreme event is so difficult. The same applies also to the total damage caused by the extreme events. (Analysis has shown that insurance statistics cannot do that as they are also affected by multiple severely biasing factors.)
Perhaps the bunnies would like to take Eli’s (stolen from elsewhere) twitter climate scientist quiz. Pick A or B as to what you think the attitude of climate scientists is
A little more seriously, Taleb’s point is that if you don’t know the mode you have not a clue about the wings.
Eli,
Yes, I saw your tweet.
Wouldn’t someone like Nic Lewis argue that he does know the mode and the wings? Hence the point I was trying to get at in the post – this is only true if all your assumptions are correct, which – to some degree or another – they’re not.
[Mod: unnecessary] What is the point of saying “He emphasizes very strongly the ubiquitousness of power law tails, but my own feeling is that the power law has also been used beyond its limits of applicability, and that Mandelbrot has contributed to that.”, when your “feelings” have nothing to do with science?
It takes a few moments to determine whether some physical situation is governed by fat-tail statistics and is actually more ubiquitous than Pekka wants us to understand. Take the situation with volcanoes, and how volcanic events are statistically characterized. This is the contemporary entropy-maximization view of power-law statistics. If you don’t like volcanoes, just take a look at the distribution of wind speeds. Could go on and on with these cases.
I really have no idea why Pekka takes this attitude of marginalizing every idea that comes down the pike and his overwhelming desire to shut down discussion because in his own words the inability of “blogs can explain to even a restricted audience”.
It looks like Nassim Nicholas Taleb’s Black Swan events are a bit different to Karl Popper’s Black Swan fallacy.
I consider the Arctic warming and loss of sea ice a black swan event. Perhaps the western Antarctic warming as well.
Related slightly to talebs black swan idea is this excellent paper on how complex systems fail.
Click to access How%20Complex%20Systems%20Fail.pdf
Should be required reading in all sorts of areas, that.
Harry,
Yes, they qualify as being unexpected. Personally, I see them as being examples of unexpected outcomes, rather than a Black Swan events specifically.
topflat,
Interesting, thanks.
Some possible black swans..
The world gets by on perhaps 6 weeks of food stocks at any one time. This is itself not much comfort – a big volcanic eruption or meteorite impact could easily cause a famine because of this – but in terms of global warming we don’t usually worry, because we also have significant food over-supply globally. We feed a lot to animals, and we waste a lot. The ‘black swan’ is a systematic change in atmospheric circulation which wrecks the NH harvest, with a secondary effect that governments, predictably, start banning food trade to protect their stocks, making the situation much worse.
We find that large areas of permafrost start to melt for the first time in 2 million years as a result of polar amplification; these in turn catch fire over large areas, and these fires self-perpetuate, melting more permafrost as they go. Meaning that we get a huge slug of extra CO2 and methane in less than a decade.
The WAIS transitions from grounding line gradual retreat to full scale gravitational collapse. Sea level starts to rise at a meters-per-decade rate.
These events are, as far as I can tell, almost outside of consideration. We expect food production to adjust gradually and with slack to take up any shocks (independent distribution of bad harvests). We expect carbon feedbacks to be manageable and slow. We expect SLR to be meters per century at worst.
I’d add – the dependence of much of the world on trade for food, fuel, clothing, etc is probably the biggest amplifying factor as far as humanity is concerned. Because if food shortages appear – or even just appear imminent to first world countries – the shutters will come down faster than most people believe possible.
Topflat
Considering our civilisation as a complex system, perhaps your link should be required reading for every politician.
There are several examples of unexpected civilisation failure modes currently happening.
Consider that the current instability in Syria started with a four year drought, to which the Assad government failed to respond. The instability in Egypt began with food riots, after the government was forced to raise subsidised bread prices. Brazil is in an ongoing water crisis due in part to political refusal to recognise the problem.
Perhaps democracies have a built in design flaw. Politicians face an unresolvable conflict between necessary action and reelection.
Regarding Gray Swans. Two of the largest crude oil reservoirs in the world, Mexico’s Cantarell and Saudi Arabia’s Ghawar are considered gray swans. They fit in nicely with a power law distribution of reservoir sizes. It is a low probability occurrence that another Ghawar will be found in the world, as the odds have eventually been used up in the distribution. But it still could happen.
The question is whether something like the Bakken or Athabasca is a black swan. The formation of the Bakken isn’t conventional salt dome dynamics and so is unique enough to be set aside from a distribution.
“Additionally, the climate model results are also consistent with paleo estimates.”
This is a very questionable claim. I guess if you mean that the uncertainty of paleo estimates is so large as to not exclude climate model results then you are correct. Many paleo estimates have assumptions that are even more questionable than the climate models or the energy balance results.
One thing I want to add (especially after reading the Van Hateren paper) is that maybe people need to move away from the concept of the ECS. TCR and ESS are both very clearly defined, but ECS isn’t and its definition tends to vary a lot by study. This results in a higher perceived uncertainty in climate sensitivity than there should actually be. Perhaps the focus should shift more to the question of ‘what is the climate response impulse function to a change in forcing?’.
-1,
No, what I mean if you look at the paleo estimates for CS and look at those from climate models they have a similar range (2 – 4.5K).
I think ECS is well-defined. Some people, however, might not use ECS as it is defined. The problem that I see with ESS is that it is more likely to depend on climate state (ice-albedo feedback) than the ECS.
-1
Speaking of making questionable claims…
You did not demonstrate to anyone’s satisfaction other than your own that ECS falls as T rises. Moreover, your own numbers – were one to accept them – showed a vanishingly small diminution of ECS, certainly far below the level at which it would have any measurable effect. In other words, it would be climatologically insignificant. But now, here you are asserting this inverse relationship as a matter of established fact. Now that is, at the very least, a questionable claim.
ESS from the Holocene baseline is somewhere around 5C. ESS from a hot baseline (eg. Paleocene) with a reduced or absent cryosphere appears to be less – perhaps ~4C. When we are speaking of our present position in the Holocene it is misleading to imply that ESS ‘decreases with temperature’.
ECS (~3C) is manifested in the land-only temperature readings. There is no heat sink on land so it receives the brunt of the GHG thermal forcing.
http://contextearth.com/2014/01/25/what-missing-heat/
Ever heard of spray coolants? That analogy can be applied as well.
Good thing that people don’t live on land.
Don’t think 9/11 works well as black swan event. Tom Clancy wrote about a very similar scenario well before it happened (a hijacked airliner being flown into the U.S. Capitol). One can only speculate as to why precautions were not taken thereafter.
climatehawk,
Except that is kind of the point of a Black Swan event: it could have been anticipated, but wasn’t.
Maybe so. I think of Black Swans as events that are wrongly (in retrospect) viewed as very low probability. Once a bestselling novelist has written about a terror scenario that is easy to carry out, it is hard for me to continue to see it as low probability.
climatehawk,
Yes, maybe, although part of the Black Swan idea is the idea of “fat tails” which suggests that these events are more likely than if the distribution were assumed to have a more normal thin tail.
Sometimes is not a Black Swan at all:

Speaking of GCMs and TCR.
weirdly the hindcast response to changes in forcing is much lower than the response in forecasts.
Dunno. never got to the bottom of this one. Top chart.
http://berkeleyearth.org/graphics/model-performance-against-berkeley-earth-data-set#temperature-response-to-greenhouse-gases
Lucifer
That is just Quacker’s. 🙂
“However, certainly in the case of Judith Curry, and probably in the case of Nic Lewis, the assumption of negligible internal variability contradicts their views on the topic.”
Err no.
Hmm, That was my thought reading the first draft and there were a couple responses to that.
1. Nic tried to pick beginning and end periods where you minimized the effect of things like volcanos
and where internal variability was more likely to be minimal.
2. Methodologically he was accepting the assumptions of this approach to see what it would yield when updated data was used. In other words, people had no issue with this method when it produced answers in line with GCMs.
In other words. This type of approach was used before without complaint, what’s the big deal now?
the numbers are slightly lower.. shrugs. I’m not surprised. I expect 51% of new studies to be below
3C ecs. nothing odd there. Folks might make hay out of that or ‘count’ studies. meh.
I suppose this goes to the larger problem of how people want to synthesize the various approaches into one final PDF for TCR or ECS. how much weight do I give to paleo? how much to “observational” methods, how much to GCM? On some days I think that if this were any other field people would just note the differences, note the pros and cons, and press on trying to improve each approach. However, since a meta analysis has been assigned ( what’s the consensus ) it gets written. and then folks want to see exactly how that sausage was made. damned if you make the sausage, damned if you dont. so ya, andthentherespolitics
“The time series to fit the statistical model on would be very short for C&W. That would probably be a problem.”
The record extends to 1850 for CWkrigv2 (available online) and BEST goes back further (though i’d probably limit to 1850 as well for this type of calculation.
ATTP,
I think you’re missing another important factor – change in forcing is likely underestimated.
So when change in temperature is greater than NicL’s method uses and the change in forcing is lower then you get a higher TCR…
Steven Mosher,
“Speaking of GCMs and TCR.
weirdly the hindcast response to changes in forcing is much lower than the response in forecasts.
Dunno. never got to the bottom of this one. Top chart.”
That’s unexpected. You’d expect it to be the other way around since we’re going from a cold to warm state.
Steven,
Yes, I’ve often wondered the same. In other fields these different approaches would be seen as somehow complementary, rather than as ways of trying to show that one is somehow better than the other.
Robert,
Yes, that’s a good point.
Robert..
“That’s unexpected. You’d expect it to be the other way around since we’re going from a cold to warm state.”
Unfortunately we got sidetracked into other stuff and never followed up. it was a head scratcher.
—
I’ve mentioned it previously on this blog, but… Here are the TCR estimates that I get from applying a statistical, Bayesian regression model (using a noninformative prior) on three instrumental temperature records:
In case the above image fails to load, the mean TCR estimates [and 95% credible intervals] are:
HadCRUT4: 1.5 °C [1.4-1.7]
Cowtan & Way (2014): 1.6 °C [1.4-1.8]
GISTEMP: 1.7 °C [1.5-1.9]
I am hardly claiming that this is the definitive word on the matter. However, from a statistical time series perspective, it is worth pointing out that these temperature records are long enough to yield (imply?) fairly precise estimates of TCR.
Steven Mosher
WRT models struggling with Arctic amplification, have you seen Najafi et al. (2015) Attribution of Arctic temperature change to greenhouse-gas and aerosol influences?
Looks like the negative aerosol forcing effect is greater in the Arctic – otherwise amplification would have resulted in much higher temperatures than observed.
“Yes, I’ve often wondered the same. In other fields these different approaches would be seen as somehow complementary, rather than as ways of trying to show that one is somehow better than the other.”
I think there is gunna be one class of people who are more comfortable coming up with pragmatic approaches to synthesizing these things, but in my experience , we just lay out the pros and cons and passed the problem to decision makers.. This method says X, that says Y, some say Z.. you could “average” them I suppose.. but I aint gunna bet on that.. above my pay grade. Of course people “above your pay grade” sometimes want “an answer” which in business is just CYA.
WRT models struggling with Arctic amplification, have you seen Najafi et al. (2015) Attribution of Arctic temperature change to greenhouse-gas and aerosol influences?
Looks like the negative aerosol forcing effect is greater in the Arctic – otherwise amplification would have resulted in much higher temperatures than observed.
I may have glanced at that. thanks for the reminder. I hope to get back to the GCM work, but for now there is other pressing stuff
Steven,
I’m probably just being a bit dense, but I wasn’t quite sure what you meant by the above (or which figure in your link was the one you actually meant).
sorry its the top figure plotting the response to forcing during hindcast to that during forecast
Michael Hauber, here is the average summer (July to September) Arctic sea ice extent from Walsh and Chapman, 2008:

And the Arctic average temperature over essentially the same period:
From visual inspection, the correlation is too low to sustain the idea that the response is a short term, or linear response to warming. In particular, the period 1980-2010 shows a linear trend in temperature and an exponential decline in sea ice. The correlation with global temperatures is even worse, with the most rapid decline in sea ice following the most rapid increase in temperature by about a decade, but that may be attributed to a lack of homogeneity of response to temperatures.
The same point can be made about cumulative changes in glacial length:
With respect to Connolley, can you provide a link to his study?
With apologies,
Arctic temperatures
Glacial length
I am still having problems working out how to post images with wordpress.
Steven Mosher:
If that was his intent, he failed, given that he places most weight on the most recent decades, which show a very large shift in ENSO values. Further, despite claims to have matched values on the AMO, the start and end decades of their analysis do not have similar values for the AMO, with the end period having a higher mean AMO index value.
I do not have an issue with this method. I have an issue with it being claimed to be the sole effective method of determining TCR or ECS. Further, I have an issue with Lewis and Curry (2014) in particular because they used a value for OHC from a single unconfirmed paper giving a radically different value from other estimates, while ignoring the fact that the same paper gives inconsistent values with modern observations. Had they either used standard values (as with Otto et al) or scaled the values from their preferred source so that the values over the period of OHC observations matched those observed I would have no major problem with it; although there are a number of minor issues where arguable choices by Lewis and Curry uniformly reduce the determined ECS.
Further, while there are some issues with using energy balance to determine ECS (as with all methods of determining ECS), those which are intrinsic to the method have been canvassed in the literature going back to the first use of the method.
To post an image in WP, simply paste the URL of the image on a single line, with nothing else:
http://neven1.typepad.com/.a/6a0133f03a1e37970b01b8d0dab126970c-pi@ATTP-
“I think ECS is well-defined. Some people, however, might not use ECS as it is defined. The problem that I see with ESS is that it is more likely to depend on climate state (ice-albedo feedback) than the ECS.”
Its definition is not as precise as TCR or ESS. What constitutes a fast-feedback vs a slow-feedback when in reality there is a continuum of different feedbacks with time scales varying between fast and slow? At what point in time under what emission scenario can you say that the ECS has been reached? In most cases the definition is okay, but I’m just pointing out that some of the uncertainty in the findings maybe due to the impreciseness of the definition and perhaps it makes more sense to try to estimate a climate impulse response function that try to estimate the 3 numbers TCR, ECS and ESS. The climate impulse response function would also be much better at making predictions and being used for policy considerations.
@BBD-
“showed a vanishingly small diminution of ECS”
Could you please define ‘vanishingly small diminution of ECS for me? Preferably in a mathematical form.
“ESS from the Holocene baseline is somewhere around 5C. ESS from a hot baseline (eg. Paleocene) with a reduced or absent cryosphere appears to be less – perhaps ~4C. When we are speaking of our present position in the Holocene it is misleading to imply that ESS ‘decreases with temperature’.”
Could you please point to a study that excludes at the 95% confidence level that the ESS does not decrease with temperature?
I believe this is what Michael Hauber was referring to: Schröder, D., and W. M. Connolley (2007), Impact of instantaneous sea ice removal in a coupled general circulation model, Geophys. Res. Lett., 34, L14502, doi:10.1029/2007GL030253.
On the same subject and a little more recent you’ll find Recovery mechanisms of Arctic summer sea ice, S. Tietsche, D. Notz, J. H. Jungclaus andJ. Marotzke, Article first published online: 26 JAN 2011, DOI: 10.1029/2010GL045698
Both papers explore what happens (in a GCM) if the arctic sea ice is removed all at once. Both show that the sea ice recovers in a relatively short time-period; less than 5 years.
What I took away from both papers is that there are strong negative feedbacks in the arctic that accompany sea ice loss (open water gives up a lot of energy to space in the arctic night).
@-“Could you please point to a study that excludes at the 95% confidence level that the ESS does not decrease with temperature?”
No study or confidence intervals required, only logic.
If ESS decreased to an extent that would be significant for the range we are in now, then it would significantly affect the ice-age cycles. Unless ESS stays above a minimum value at global mean temps well below present values the climate would never leave an ice-age.
Have a look at how much of the Greenland ice-cap melted out in the Eemian. Arguing about the decimal place on ESS when the physical data show what changes can and do happen seems…
http://www.nasa.gov/content/goddard/nasa-data-peers-into-greenlands-ice-sheet/#.VO11SfmsXTo
eyepie –
ECS is important on human-civilization timescales.
I think that asking for an impulse-response function is simply asking for an impossibility. The earth is a heterogeneous system , and the timing of feedback events – such as ocean circulation changes, ice sheet disintegration and the like – affected by internal variability. At best you’ll get a probability distribution.
Economists have played pseudo-physics – see Beenstock.
Now the shoe is on the other foot.
Physicists make ‘weather forecasts’ for economies
http://www.nature.com/news/physicists-make-weather-forecasts-for-economies-1.16963
“The development of some countries is as predictable as steady winds, but for others it is more chaotic, physicists find.”
In reply to what Tom Curtis said on February 23, 2015 at 11:44 pm, Steven Mosher said on February 24, 2015 at 6:01 pm:
“”However, certainly in the case of Judith Curry, and probably in the case of Nic Lewis, the assumption of negligible internal variability contradicts their views on the topic.”
Err no.
Hmm, That was my thought reading the first draft and there were a couple responses to that.
1. Nic tried to pick beginning and end periods where you minimized the effect of things like volcanos and where internal variability was more likely to be minimal.”
Then Tom Curtis replied:
“If that was his intent, he failed, given that he places most weight on the most recent decades, which show a very large shift in ENSO values. Further, despite claims to have matched values on the AMO, the start and end decades of their analysis do not have similar values for the AMO, with the end period having a higher mean AMO index value.”
This part about something related to the AMO is what I had in mind, too: Many of those who reject mainstream climate science on sensitivity promote this idea of multi-decadal – as in 45-60 year – internal variability with respect to the oceans, this variability being perhaps quite strong. (See how they including Judith Curry trumpeted that paper by Tung and Chen.)
It seems that Lewis did not properly try or failed in properly trying to take into account a possibly large and possibly dominating 45-60 year cycle around an upward trend curve (as hypothesized by Tung and Chen, and Lovejoy as well when he addressed the record over the long term).
But it seems that Marotzke and Forster did try and succeed at properly addressing such a possible multi-decadal, 45-60 year cyclic behavior: I think it notable that they got much better matches to the models with the 62 year runs than with the 15 year runs.
-1
IIRC you Look back at your own calculations instead of sealioning me. Quote your own numbers instead of sealioning me. As always, the words mean what they mean. In this case vanishingly small diminution is synonymous with climatologically insignificant.
Like tr0lls everywhere, you are taking up an inordinate amount of thread saying nothing but playing word-placement games.
@ izen –
“No study or confidence intervals required, only logic.”
You mean like the fact that you eventually run out of the ice-albedo feedback?
“If ESS decreased to an extent that would be significant for the range we are in now, then it would significantly affect the ice-age cycles.”
I think you are confusing two concepts. One that paleoclimate data excludes the possibility of an ESS that decreases with temperature at the 95% confidence level (which it doesn’t, but I invite others to prove otherwise), and one of ‘climatological significance’, whatever that means.
@ Andrew Dodds –
I highly suggest you read Van Hateren 2012. I think that methodology applied to time series analysis can yield a decent approximation of the climate impulse response function.
@ BBD –
As usual, you refuse to define things. And here I thought that clear definitions was important in science…
Okay, let’s calm this one down. If we’re still arguing about “climatologically significant” (which I had thought was fairly obvious) maybe we could simply stop now.
Tom Curtis.
Fair Comments. One thing I suggested to Nic was that he post up code so that folks could change his ‘choices’. I had a similar reaction when I was reading through one of Hansens papers on LGM.
The discovery of black swans in the 18th century would have been more disconcerting had they been the size of elephants, which they were not.
The actuarial plausibility of catastrophic excursons from the mean is coupled to the mass and inertia of the system in question, and the thermal inertia of planets trends towards the elephantine.
To preempt the obvious reply, physical systems are scarcely analogous to Taleb’s artificially leveraged derivatives markets
As some may recall, the title of Eli’s post was Black Swans, Black Cats. Black Swans are events that happen in the wings. Taleb’s point is that the wings can be quite significant and just saying never happened before is not reassuring. Black Cats, are when you have the bad luck to encounter a Black Swan event that is really, really on the unlucky side. That is Weitzmann’s point. Weitzmann and Taleb are not saying the same thing but the combo is nasty.
Eli,
Ahhh, I hadn’t quite appreciated that subtlety.
That’s not quite correct given that Taleb explicitly characterises a black swan event as one having high impact. Nonetheless, the distinction is certainly important.
Joe Romm (whom I must say annoys me tremendously at times) did an excellent job of explaining this subtlety in a older defence of Weitzman’s work. It is the damages function along the distribution of warming that really matters, not the probability distribution (of warming) itself. More here.
Grant,
Let me check if I understand this. What Weitzman is suggesting is that what should dominate our decision making are the low probability events that could be catastrophic. So, it’s not just the probability of the event that we should consider, but the damage due to the event that matters. Is that about right?
ATTP,
Yes, that sounds like the correct interpretation to me.
Really, Weitzman’s central contribution was to formalise this rather intuitive notion (i.e. the need to insure against low probability, but catastrophic events) in a clear theoretical framework. What properly captured everyone’s attention though, was his model’s inexorable conclusion: The impact of these catastrophic events was so overwhelming that we should theoretically be willing to sacrifice an infinite amount of money to prevent them from happening. It was something of a damned-if-you-do-damned-if-you-don’t result… which is why it has since become known as Weitzman’s “dismal theorem”.
Now, there has been a lot of discussion regarding how much of this particular result hinges on the exact setup that Weitzman uses to advance his argument. The short answer is “quite a lot” and this is something that Weitzman readily concedes. He has taken pains to acknowledge that his choice of “mathematical shell” is arbitrary. However, this does little to undermine his central point: We ignore low-probability, high-impact events at our peril, and they should almost certainly cause us to be much more ambitious in our mitigation efforts than IAMs and other standard cost-benefit methods suggest.
P.S. I should also say that many of the criticisms of Weitzman’s initial framework are not particularly robust in of themselves. They can easily be accommodated by reasonable extensions of the model. I have already shared this with ATTP over Twitter, but my favourite overview of the whole debate is by Millner (2013): “On welfare frameworks and catastrophic climate risks“. There should be a couple of ungated copies floating around the internet for those of you without access to the journal.
The original Weitzmann’s dismal theorem required both fat enough tails and very high damages. Others, including, Nordhaus pointed out that the theorem involved some contradictions and that the corrected outcome is not quite that bad. These issues are, however, perhaps more formal than really important in practice. Many of the strongest results of economic models are true only, when the time periods get too long to be really meaningful.
Professional gamblers are having problems managing a 10k investment:
http://papers.ssrn.com/sol3/papers.cfm?abstract_id=1465188
Insert your favorite metaphor.
Grant McDermott said on February 25, 2015 at 10:25 pm:
“Weitzmann and Taleb are not saying the same thing but the combo is nasty.
That’s not quite correct given that Taleb explicitly characterises a black swan event as one having high impact. Nonetheless, the distinction is certainly important.
Joe Romm (whom I must say annoys me tremendously at times) did an excellent job of explaining this subtlety in a older defence of Weitzman’s work. It is the damages function along the distribution of warming that really matters, not the probability distribution (of warming) itself. More here.”
…and Then There’s Physics said on February 25, 2015 at 10:38 pm:
“Grant,
Let me check if I understand this. What Weitzman is suggesting is that what should dominate our decision making are the low probability events that could be catastrophic. So, it’s not just the probability of the event that we should consider, but the damage due to the event that matters. Is that about right?”
(Preliminary note: Read Weitzman’s statement below on probability distributions beginning with the phrase “What is worrisome…” for one answer to this last question.)
I recommend that everyone read Weitzman – he seems to take all the implications of Sherwood and Huber more seriously than any other economist. See this from 2011:
Fat-Tailed Uncertainty in the Economics of Catastrophic Climate Changehttp://scholar.harvard.edu/files/weitzman/files/fattaileduncertaintyeconomics.pdf
Quotes:
“At first, I was inclined to debate some of the critics and their criticisms more directly. But, on second thought, I found myself anxious not to be drawn into being too defensive and having the main focus be on technical details. Instead, I am more keen here to emphasize anew and in fresh language the substantive concepts that, I think, may be more obscured than enlightened by a debate centered on technicalities. I am far more committed to the simple basic ideas that underlie my approach to fat-tailed uncertainty and the economics of catastrophic climate change than I am to the particular mathematical form in which I have chosen to express them. These core concepts could have been wrapped in a variety of alternative mathematical shells-and the particular one that I chose to use previously is somewhat arbitrary. The implications are roughly similar, irrespective of formalization. Some technical details are unavoidable, but if I can give the underlying concepts greater intuitive plausibility, then I believe that this set of ideas will become more self-evident and more self-evidently resistant to several of the criticisms that have been leveled against it.
…
…more than half of today’s human population would be living in places where, at least once a year, there would be periods when death from heat stress would ensue after about six hours of exposure. (By contrast, the highest wet-bulb temperature anywhere on Earth today is about 30C). Sherwood and Huber (2010) further emphasize: ”This likely overestimates what could practically be tolerated: Our [absolute thermodynamic] limit applies to a person out of the sun, in a gale-force wind, doused with water, wearing no clothing and not working.” Even at wet-bulb temperatures, much lower than 35C, human life would become debilitating and physical labor would be unthinkable. The massive unrest and uncontainable pressures this might bring to bear on the world’s human population are almost unimaginable. The Earth’s ecology, whose valuation is another big uncertainty, would be upended. Thus, a temperature change of [approximately] 10C would appear to represent an extreme threat to human civilization and global ecology as we now know it, even if it might not necessarily mean the end of Homo sapiens as a species.
…
What is worrisome is not the fact that the upper tail of the PDF of lnD is long (reflecting the fact that a meaningful bound on diswelfare does not exist), but that it might be fat (reflecting the fact that the probability of a catastrophic outcome is not sufficiently small to give comfort). The critical question, which tail fatness quantifies, is how fast does the probability of a catastrophe decline relative to the welfare impact of the catastrophe.”
I strongly note this quote: “Even at wet-bulb temperatures, much lower than 35C, human life would become debilitating and physical labor would be unthinkable. The massive unrest and uncontainable pressures this might bring to bear on the world’s human population are almost unimaginable.” Note that a wet-bulb temperature of 35 degrees C is equivalent to a heat and humidity heat index or “feels like” temperature of roughly 170-196 degrees F” – almost 200 degrees F.
I also strongly note some of my prior comments in which I pointed out the fact that Sherwood and Huber also pointed out that this catastrophe of typical summertime highs so high that all mammals would be dead in 6 hours will happen to some portions of the globe not with a 10 degree C increase but with only a 7 degree C increase, and that I pointed out the consequences of this. This would be that mammalian populations – including billions of humans and therefore of course human civilization – in these areas would have become nonviable *long before* the time we have a 7 degree C increase – an approximate 5 degree increase may be all it would take. That is, reaching the point of typical summertime afternoon heat index highs of around 150 degrees F that may occur with just a 5 degree C increase may be all it takes to make mammalian pollutions and human civilization nonviable in many areas throughout the tropics and subtropics. This is because even though this is not enough to kill all mammals in these areas, it is enough to kill sufficient percentages of mammalian populations with sufficient frequency to make these populations and civilization nonviable in these areas.
And of course, this latter happening would put a catastrophic pressure on all of human civilization – because think about it: If those billions in the tropics and subtropics including nuclear powers such as a nuclear India had to move north to survive in a viable way, do you think that a nuclear Russia with all that real estate (and given their penchant for not-so-moral dictators like Stalin and Putin) would say, “fine and dandy, we will share all this real estate we own out of the goodness of our hearts!”?
Again: Weitzman seems to take all the implications of Sherwood and Huber more seriously than any other economist. Even then, he still does not take them seriously enough – the implications including what I said above are that serious.
(Living essentially all my life in an already-hot-enough-and-already-close-to-being-too-hot high-humidity environment in the subtropics may give me a perspective on the implications of Sherwood and Huber that those living in cooler climates cannot appreciate. I’ve experienced an uncomfortable increase in he summertime heat and humidity with a global temperature increase of only roughly 0.5 degrees C. I know that an entire order of magnitude greater increase of approximately 5 degrees C would make this environment too hostile to mammals – it would simply be deadly to too many too often, and it would simply be too close to being deadly for those who wouldn’t actually die.)
KeefeAndAmanda,
Speaking as an economist, this is not an accurate statement. The twin spectres of structural uncertainty and catastrophe have been defining features of climate economics since the field’s inception. They were central tenants of The Stern Review (although he was justifiably criticized for some of the ad hoc ways in which he incorporated them into his framework); William Nordhaus titled his book “The Climate Casino” because of them; every single conference that I go to has plenaries specifically dedicated to them; etc., etc.
What I have tried to emphasise in my comments above, however, is that Weitzman has become the de facto reference on the subject because of the way in which he formalised the debate. In so doing, he was able to move the underlying theory beyond the ad hoc weaknesses of Stern and co., and cast a new light on the way in which modellers tried to account for truly devastating climate damages in their IAMs.
Grant McDermott said on February 26, 2015 at 7:39 am, in reply to my comment on February 26, 2015 at 2:29 am:
“”Again: Weitzman seems to take all the implications of Sherwood and Huber more seriously than any other economist.”
Speaking as an economist, this is not an accurate statement. The twin specters of structural uncertainty and catastrophe have been defining features of climate economics since the field’s inception.”
In some of his writings (I already cited one above and another one in a prior comment in another thread), Weitzman talks of extreme threats to human civilization and the ecosystem including most importantly mammalian populations *even with* wet-bulb temperatures *much less* than that 35 degrees C threshold of Sherwood and Huber. (These emphases are important. I spoke of this inability of mammalian populations to survive in a viable way even in conditions much less than that 35 degree C threshold not only above but in some of my prior comments in other threads.)
Writings like this suggest to me that the author is *very* worried about the future survivability of not just human civilization but of the entire ecosystem revolving about that pinnacle of evolution, the mammals, simply from heat indexes simply becoming too high in more and more of the world. If there are other professional economists whose writings in general seem to show at least this much worry about these potential horrors implied (not merely specifically addressed) by Sherwood and Huber, these implications being from heat indexes simply becoming too high for mammalian populations to survive in some viable way in more and more places *even well below* that wet-bulb threshold of 35 degrees C, then please cite those economists.
Pingback: Some thoughts on internal variability | …and Then There's Physics
Thus far in this centiry’s Elizabeth Islands statistics all of the injuries sustained by inquisitive children trying to hug swans have been inflicted by white ones.
One of these years, somebody is going to lose an eye.
Pingback: Matt Ridley on fossil fuels | …and Then There's Physics
Pingback: Matt Ridley is wrong again on fossil fuels
Just a note:
I saw this:
“Or did not want to think of: most nuclear power plants are not protected against aircrafts flying into them.”
and that is factually incorrect. How do I know this? I know the guy who ran the tests, he is my Dad. Back when I was a kid he gave me a set of 8x10s of this test:
That test was requested specifically to find out what happened if a plane hit a containment dome. They made some models and decided the answer was ‘Destroyed plane, a little dirt to clean up, not much else’. However, unlike climate scientists, the nuclear folks like to test things. So they built a portion of the wall (12 foot thick, cement and rebar), put it on the rocket sled track at SNL and ran an F4 Phantom into it at 480 MPH. From this they got the numbers they needed to interpolate and confirm the model.
For the record, the deepest dent in the wall was about 2 and half inches.
Eric
Pingback: Non-linear feedbacks | …and Then There's Physics
Pingback: Precautionary measures | …and Then There's Physics