
There’s been a bit of a discussion on Twitter about what it would take to stabilise atmospheric concentrations, or to stabilise global average temperatures (there seemed to be some confusion as to which was being stabilised). The bottom line seems to be that if we want to stabilise atmospheric concentrations, then we’d need to reduce emissions by something like 80%. If we were to halt them altogether, then concentrations would drop and would do so almost exponentially, with an equilibration timescale of around 200 years (see Archer 2009, Figure 2).
However, the atmospheric concentration will asymptote towards a long-term concentration in which atmospheric CO2 is enhanced, relative to pre-industry, by an amount that is equivalent to 20-30% of our total emissions (possibly more if we were to emit a total of a few 1000 PgC). So, it turns out that even though atmospheric concentrations will drop, temperatures will approximately stablise, since the reduction in atmospheric CO2 is matched by the fact that the system was not yet in equilibrium when emissions were stopped (see Steve Easterbrook’s post, this Realclimate post, or Solomon et al. (2008)).
What I wanted to do hear was try to roughly illustrate this.
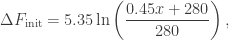
At the moment, atmospheric concentrations are enhanced by an amount roughly equivalent to 45% of our total emissions. The resulting change in forcing is:
where 


where 

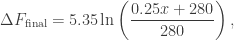
If we halted all emissions, then atmospheric concentrations would decay and eventually settle (after hundreds of years) to a long-term concentration which is enhanced (relative to pre-industry) by an amount equivalent to about 25% of our total emissions. In that case, the long-term change in forcing would be:
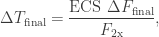
and the eventual warming would be:
where we’ve used the 
Now, imagine we halt all emissions after emitting a total – in ppm – of

Once atmospheric concentrations reach their long-term value, the warming would be

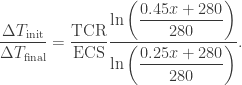
If you take the ratio, you get
For reasonable values of 

In reality, of course, we can’t simply halt all emissions, so there will be future warming that will depend on how much we emit between now and when net emissions get to zero. However, what seems pretty clear is that stabilising temperatures will probably require halting emissions (net). I should add that if we were to emit a lot more, we would expect the airborne fraction to increase. However, we would also expect the fraction that remains for millenia to also increase. The TCR-to-ECS ratio may also be such that it could continue to warm slightly were we to get emissions to zero, or cool slightly. However, unless I’ve made some kind of silly mistake (I did do this rather quickly) as a rough estimate, our committed warming is about the same as the transient warming at the time when we get emissions to zero.

Isn’t there another dark horse at play? If we stop emissions, we likely also reduce aerosols. Those may mask quite a bit of warming. Or is that included already?
The bottom line seems to be that if we want to stabilise atmospheric concentrations, then we’d need to reduce emissions by something like 80%.
This number for which Richard Betts could not give a source seems to be inconsistent with:
However, the atmospheric concentration will asymptote towards a long-term concentration in which atmospheric CO2 is enhanced, relative to pre-industry, by an amount that is equivalent to 20-30% of our total emissions
The difference may be one of time scales. If we would have an abrupt large decrease in CO2 emissions, say 80%, there would be a temporary dip in the CO2 concentration and at the time scale of the duration of the dip you might be allowed to say you stabilized the CO2 concentration. In the long run, however, your second statement would be right and of the remaining 20 percent we would still emit, 20 to 30% would remain in the atmosphere and the CO2 concentrations would thus rise. CO2 concentrations would thus rise as long as emissions are not zero.
In reality also in the long term the emission could be a bit larger than zero because of natural removal mechanisms, but these are very small. It is not my field, I do not know how small, but I would think of no more than a few percent. The last ICCP report had a Frequently Asked Questions on the stabilization of CO2 concentrations.. The IPPC writes (my emphasis):
In fact, only in the case of essentially complete elimination of emissions can the atmospheric concentration of CO2 ultimately be stabilised at a constant level. All other cases of moderate CO2 emission reductions show increasing concentrations because of the characteristic exchange processes associated with the cycling of carbon in the climate system.
The main reason for a drop in the CO2 concentration after an abrupt decrease in emissions would be the take up by the oceans and the biosphere. This does not follow an exponential law for a (chemical) removal that is proportional with the concentration (like you would have for methane).
If we were to halt them altogether, then concentrations would drop and would do so almost exponentially, with an equilibration timescale of around 200 years
This equilibrium time scale is thus somewhat arbitrary because such a time scale is only defined for an exponential decrease in concentration.
The IPCC FAQ also shows that exponential decay does not fit for CO2:
FAQ 10.3, Figure 1. (a) Simulated changes in atmospheric CO2 concentration relative to the present-day for emissions stabilised at the current level (black), or at 10% (red), 30% (green), 50% (dark blue) and 100% (light blue) lower than the current level; (b) as in (a) for a trace gas with a lifetime of 120 years, driven by natural and anthropogenic fluxes; and (c) as in (a) for a trace gas with a lifetime of 12 years, driven by only anthropogenic fluxes.
Hi Victor
The 80% in my tweet was from reading off panel a of the IPCC figure you show.
Cheers
Richard
The statement that if we stopped all emissions CO2 concentrations would decay to a level which is enhanced by 20-30% of our total emissions is due to the BERN model. AR5 defines this mathematically on page 213 of WG1 states : “The CO2 response function used in this report is based on the revised version of the Bern Carbon cycle model used in Chapter 10 of this report (Bern2.5CC; Joos et al. 2001 [1] ) using a background CO2 concentration value of 378 ppm. The decay of a pulse of CO2 with time t is given by:
a0 + sum(i=1,3)(ai.exp(-t/Taui)) , Where a0 = 0.217, a1 = 0.259, a2 = 0.338, a3 = 0.186, Tau1 = 172.9 years, Tau2 = 18.51 years, and Tau3 = 1.186 years.
The constant term a0 implies that long term 22% of CO2 emissions will remain for ever in the atmosphere. However this is an over-simplification. Rock weathering is a temperature dependent process which acts like a thermostat to pump down CO2. Term a0 is not a constant but just has a long lifetime (thousands of years). The earth will again reach a pre-industrial equilibrium value of CO2 until another ice age begins, and the process will repeat.
Supposing, as seems likely, emissions continue to rise until 2020 and then plateau until 2100 before falling to say 50% of current levels for ever. Would CO2 levels rise inexorably for ever? I say the answer is no. There will always be an equilibrium value for CO2, as there always has been. The planet will be much warmer but Armageddon will not happen. Natural sources of CO2 (volcanoes) were much larger 50 million years ago. It is obvious that CO2 could never reach say 10% of the atmosphere since then there would be no oxygen left to burn anything.
Marco,
Today, aerosols are masking some of the GHG-warming. However, I think that the CO2-only contribution is similar to the all-GHGs minus aerosols. So, I didn’t take this into account, but if you consider CO2-only, the estimate is probably fine.
Victor,
I think you’re right, that if you reduced emissions by 80% and kept it there for a long time, then concentration would have to start rising. However, it would probably stabilise for a century or so if we did reduce by that much.
I was messing about using this Carbon cycle modeller. If you set the transition CO2 spike at 550GtC and the Simulation degassing at 125 (which is about 1.5GtC/yr) then it stabilises for about 250 years and then does indeed start rising again.
Richard,
Thanks for clarifying. Saw you had an interesting paper recently.
Clive,
I don’t know if this is true. I got it from David Archer’s work.
Assuming that by “for ever” you mean a long time, rather than actually for ever, then I think you’re wrong. As I understand it, unless we eventually get our emissions to pretty much 0, concentrations will continue to rise. You could try this carbon cycle model. Anything above about 1GtC/yr (10% of our current emissions) leads to a continued rise in atmospheric CO2.
I’ve no idea what you mean by Armageddon or why you thought to even mention this possibility.
I don’t think anyone has seriously suggested that it could get to 10%.
Richard Betts: The 80% in my tweet was from reading off panel a of the IPCC figure you show.
The panel I showed on twitter was the left panel of this figure:
It has values for 50% and 100%. Given the other lines, it does not seem like a good idea to assume that it is possible to interpolate linearly, which would give this “80%”.
If the statement of the IPCC in 2007, “In fact, only in the case of essentially complete elimination of emissions can the atmospheric concentration of CO2 ultimately be stabilised at a constant level“, is no longer valid, maybe because our understanding of the sink of the biosphere has improved, I would prefer to see a reference.
clivebest says: It is obvious that CO2 could never reach say 10%
Very reassuring that there is thus nothing to worry about.
==> The planet will be much warmer but Armageddon will not happen. ==>
Whew!
@Victor
We have to face facts as they are and deal with the likely outcome. Projected Indian coal consumption is 1.3 billion tonnes by 2040, or 50% greater than all OECD countries including USA combined. This represents 13% of current global CO2 emissions.
If we are lucky the world will stabilize emissions by 2050 and fall thereafter. With luck we may also have a viable zero carbon alternative energy source by then – nuclear fusion. Renewable energy can never provide sufficient power for a modern society – Read David MacKay’s book.
So like it or not CO2 levels will probably first double before stabilizing and then slowly decaying. (They will stabilize at some level so long as emissions never increase). The short term consequences of this are still uncertain, but look unlikely to result in extreme warming (>4C). Nature and humans will eventually adapt. The consequences of all this are probably still less than that caused by another glaciation which is due sometime before the minima in orbital obliquity in 12,000y time. If CO2 levels keep above 350 ppm another ice age will probably be avoided.
So yes there is plenty to worry about, but climate Science should grow up and start to become more responsible. It should start proposing realistic energy solutions rather than simply just lobbying for the impossible.
Joshua: Whew!
That is pure identity aggression.
Clive,
I’ve really no idea what the first part of your comment is trying to suggest. Whether or not we can reduce emissions soon does not change what will happen if we do (or don’t). That’s physical climatology.
I know you’ve said this before, but I find a remarkable thing to suggest and I suspect me pointing out the issue with what you’ve said will be as pointless now as it was the last time I did so. Climate scientists are studying our climate. They present information that others can use. They’re not responsible for finding a solution, assuming that we should be endeavouring to do so. There are plenty of others who can work towards solutions, given the information provided.
clivebest says:
[Coal in India in 2040 where solar energy is now cheaper than coal.]
[Communist book on renewable energy on isolated island called the modern society claiming that the holy free market is unable to bring supply and demand together.]
“So like it or not CO2 levels will probably first double”
That is: I do not like the solutions, thus there is no problem. No need for any argumentation or computations on how much CO2 emission will need to drop to stabilize the CO2 concentration or the temperature.
I am sure Willard has a term for your argumentative structure.
So yes there is plenty to worry about, but climate Science should grow up and start to become more responsible. It should start proposing realistic energy solutions rather than simply just lobbying for the impossible.
Climate science should study climate change. Citizens and their representatives should propose realistic energy solutions.
It seems that grown ups are lucky and abstract concepts are childlike.
Perhaps we should also exhort Capitalism to attain some maturity, and nationalism too, whilst we’re at it. That would be a further grown up contribution to the debate, would it not?
Why we should only be concerned about “extreme” warming in the “short term” would also be a good question for a grown up.
> If we are lucky the world will stabilize emissions by 2050 and fall thereafter.
What if we’re not lucky?
If all we need to be lucky is to expect to be lucky, then so much the worse for facing facts and likely outcomes.
***
Here’s the argumentative structure, VictorV:
It doesn’t appear that any of the above tries to take into account the CO2 and methane emissions from melting permafrost and clathrates. It seems that would at least keep the level of CO2 from dropping as fast as might otherwise be the case.
Dave,
Indeed, it doesn’t include potential carbon cycle feedbacks.
If we are lucky the world will stabilize emissions by 2050 and fall thereafter.
What if we’re not lucky?
As you know, estimates of CO2 emissions have been flat since 2013.
So we may be more than lucky, though luck didn’t have anything to do with it.
Predictions of multi-factoral global trends are always uncertain, but just so I’m on record here:
Global CO2 emissions already peaked in 2013
This is fairly easy to predict based on existing trends, including:
1. continued increase in energy efficiency
2. continued falling fertility rates and proximate falling global population.
3. continued aging of global population
4. continued deflationary global economy ( due to aging )
TE,
Your absolute certainty is one reason I have no great interest in discussing this with you further. Obviously, I hope you’re right. For some reason, many, many, people think that you’re wrong.
ATTP – the concluding sentence of the link you provided to Archer 2009 above is worth noting:
“In contrast, generally accepted modern understanding of the global carbon cycle indicates that climate effects of CO2 releases to the atmosphere will persist for tens, if not hundreds, of thousands of years into the future.”
Ans this point is reinforced by papers such as Peter Clark et al “Consequences of twenty-first-century policy for multi-millennial climate and sea-level change” (8 FEBRUARY 2016 | DOI: 10.1038/NCLIMATE2923) which examined long term impacts based on IPCC scenarios for emissions.
So I have a query. Is your statement …
However, the atmospheric concentration will asymptote towards a long-term concentration in which atmospheric CO2 is enhanced, relative to pre-industry, by an amount that is equivalent to 20-30% of our total emissions (possibly more if we were to emit a total of a few 1000 PgC)
… consistent with Figure 1b of Peter Clark et al.’s paper? I was struggling to reconcile these.
Of course, for effects like sea level rise, the main topic of this paper, there are timescales of thousands of years for changes in the cryosphere which are (for any human/ policy perspective) effectively irreverible.
Interested in understanding how to reconcile them.
Turbulent Eddie says: As you know, estimates of CO2 emissions have been flat since 2013.
A new hiatus. Hurray!
So at least you agree that stabilizing CO2 emissions is not enough to decrease CO2 concentrations?
Figure from:
https://scripps.ucsd.edu/programs/keelingcurve/
Richard,
Yes, I think it is about the same. It’s hard to read the exact values and the y-axis has been cut, but if you consider the 5120PgC pulse, then Archer (2009) says that the long-term enhancement will be around 35% of the total emission. 5120PgC is 2403ppm, and 35% of that is 840 ppm. So, the new atmospheric concentration would be around 1120 ppm (840 + 280). If you take the 1280 PgC case, then Archer (2009) would suggest maybe 25% would remain for millenia. 1280 PgC is 600 ppm. 35% of this is 210ppm, so a new atmospheric concentration of around 490ppm.
Dave Werth says:
”
It doesn’t appear that any of the above tries to take into account the CO2 and methane emissions from melting permafrost and clathrates.
”
No worries, Dave.
Steven Mosher is on record:
Higher temperature could also cause die off of the Amazon rain forest with an estimated 20-40% for 2oC and up to 85% for 4oC. This is another potential source of CO2 as well as reducing the biospheres ability to remove CO2 from the atmosphere.
Assuming the natural world will adapt is a bit short sighted as the basis of a lot of ecosystems, trees, have a limited ability to migrate to cooler climates.
I also wonder what impact the recent forest fires have in Indonesia have had on CO2 emissions and whether these have been included in the global emission estimates for 2015.
HH,
I think that’s Richard Bett’s territory. Maybe he could comment if he is still reading this.
@HH
Every year Indonesians burn more of the tropical rainforest in Sumatra and Borneo to clear the land for Palm Oil plantations. It is a tragedy for wildlife and carbon sinks. The demand for Palm Oil is growing because of the rush to produce Biodiesel – itself a direct result of climate change policy. Biofuel is the most stupid of all mitigation schemes. If you wanted to fuel the cars with biodiesel driving down a UK trunk road , you would need to dedicate a 10km wide plantation of rapeseed down the full length of the road.
Victor –
==> That is pure identity aggression.
I was just expressing my immense relief that, as per Clive, I no longer have to worry about Armageddon. Imagine how much more time I’ll now have on my hands. Not to mention that now we can redirect resources to addressing the risk from anthropogenic climate change. 🙂
But I’m above all that identity shit anyway. I’m just this because of my concern about integrity, pure science, the integrity of the debate, and combating Lysenkoism*
*Everybody drink!
> The demand for Palm Oil is growing because of the rush to produce Biodiesel – itself a direct result of climate change policy.
In his State of the Union address, Dubya seemed more concerned about national security and economic competitivity than climate, which always changes anyway:
Intriguingly, concerns have been raised regarding that addiction.
***
Speaking of competition, here could be the most important point regarding the biofuel industry:
http://www.fao.org/docrep/010/ai411e/AI411E03.htm
But I’m above all that identity shit anyway. I’m just this because of my concern about integrity, pure science, the integrity of the debate, and combating Lysenkoism*
Good idea, we could make a drinking game out of reading Climate Etc. Would leave quite some scientists in a drunken stupor.
I fit were up to me, we would get rid of biofuels (of the current generation firing up food, no problem with making fuel out of waste). But it is not up to me. They were a political compromise to get conservatives willing to do something about climate change because it subsidises their constituents and donors: farmers and energy intensive industries.
(Last comment in moderation)
Great vid, Willard.
Just one question – What the hell is clean safe nukular energy?
Up in the Great White North, we’ve had our own conservative competitivity concerns:
http://www.ethanolproducer.com/articles/3272/canadian-rfa-executive-director-to-step-down/
http://www.agcanada.com/daily/former-biofuels-lobbyist-quits-pmo-reports-2
Speaking of climate feedbacks…
The top metre of the world’s soils contains three times as much carbon as the entire atmosphere. This means that losing carbon from the soil can quicken the pace of human-caused climate warming.
A new paper, published today in Nature Geoscience, finds this is already happening in the forests of the German Alps. Soils there are losing carbon as summer temperatures rise, the researchers say.
In the last three decades, soil carbon across the German Alps has decreased by an average of 14% – and by as much as 32% for certain types of soils.
The findings might be a sign of how soils could amplify warming in future, other scientists say.
Alpine soils storing up to a third less carbon as summers warm by Robert McSweeney, Carbon Brief, June 13, 2016
Anders, using the model you linked to, set the transition CO2 spike to 0, and the degassing spinup and simulation spinup to 15. This is equivalent to having anthropogenic emissions doubling natural volcanic emissions in perpetuity. It establishes an equilibrium CO2 concentration, which in this case is a pCO2 of just of 2000 ppmv. Then set the spinup back to 7.5, and leave the simulation at 15. You now are modelling a doubling of volcanic emissions from anthropogenic sources with a particular start date. You will notice that the pCO2 has not reached equilibrium even after a million years.
The upshot is that Clive Best is correct that there is always an equilibrium value for any given rate of human emissions carried in to perpetuity, but that the equilibrium will not be reached in any meaningful time for policy purpose, and at even very low emission rates would be catastrophic.
As an aside, his purported limit on atmospheric CO2 assumes oxygen can only be drawn from O2 molecules in the atmosphere, and not from various surface oxides. Further, it ignores the fact that once free oxygen essentially disappears from the atmosphere, available carbon will reduce, inflating rapidly the CH4 content of the atmosphere (which will no longer oxidize, and hence will have a long life time). Fortunately there are far more real limits on available carbon reservoirs.
Tom,
Thanks, I hadn’t tried those settings.
Indeed, I don’t dispute this. As you say, equilibrium does not imply “nothing to worry about”.
I think the calculated ratio of temperatures (Tinit/Tfinal) is only accurate if this equation:
\Delta T_{\rm init} = \dfrac{{\rm TCR} \ \Delta F_{\rm init}}{F_{\rm 2x}},
is accurate. The 1% increase in atmospheric CO2 per year for 70 years (the conditions TCR is based on), or a forcing increase of ~0.0523 watt/M^2 per year, is faster than net forcing has actually increased. According to the AR5 SPM, the best estimate of net forcing increased from 1950 to 1980 by 0.0227 watt/M^2 per year on average and 0.0335 watt/M^2 per year on average between 1980 and 2011. Even the current rate of increase in net forcing (including all human forcing influences) is likely somewhat lower than 0.0523 watt/M^2 per year. So the warming until now is somewhat greater than what the model based values for TCR would suggest. So if emissions were to stop tomorrow, I think the long term warming would likely be somewhat less than the final equation indicates.
Steve,
It is simply an approximation, as you presumably know.
Maybe I’m missing something, but I’m not sure how this necessarily follows. I realise that formally the TCR is defined as the response after CO2 has doubled after increasing at 1% per year, and so this isn’t the same as what we’ve actually experienced. However, I haven’t seen a conclusive argument that this means that the warming we’ve experienced after a change in forcing of , would be different to what would have happened due to the same change in forcing in a 1% per year situation.
Also, it’s not obvious that even if the above is true that it necessarily implies what you conclude, given that all that really matters is the TCR-to-ECS ratio. If that is much bigger than 0.6, then we would probably cool if we were to halt all emissions. One issue I have with the energy balance best estimates is that they often suggest a TCR-to-ECS ration of bigger than 0.8. However, this seems inconsistent with the planetary energy imbalance we currently seem to be sustaining, as I discussed here.
Steve,
Actually, I should have added that the basic result that zero emissions would approximately stabilise temperatures, actually comes from climate models. I was just doing this to provide a simple illustration of why.
“However, I haven’t seen a conclusive argument that this means that the warming we’ve experienced after a change in forcing of \Delta F, would be different to what would have happened due to the same change in forcing in a 1% per year situation.”
Well, between the 1% per year rate and, say half that rate, there is more time for response, so it seems reasonable for a slower rate of increase in forcing to yield a greater warming than the TCR would predict; if one believes the CGM’s are accurate, then it seems reasonable to me to estimate the response to the total history of forcing increase as the continuing sum of individual (pseudo-exponential decay) temporal responses to each annual increase in forcing based on a GCM’s temporal response to an instantaneous doubling… scaled down, of course based on each annual increase in forcing.
WRT TCR/ECS ratios from empirical estimates: In my April 25 post at Lucia’s about calculating empirical ESC estimates (where you commented), I found the empirical ratio of ‘pseudo-TCR’/ESC to be ~0.72. See comments #146603 and #146625, in an exchange with Carrick. I noted in the second of those comments that the empirically determined ‘pseudo TCR’ is almost certainly higher than the true empirically determined TCR would be, due to the increase in forcing being slower than 0.0523 watt/M^2 per year. So the empirically determined ratio, were forcing to increase at 0.0523 watt/M^2 per year, would likely be somewhat lower than 0.72, and not terribly far from the TCR/ESC ratios from some of the GCM’s. I agree that a TCR/ECS ratio higher than 0.8 is very unlikely to be correct, if only because of the measured rate of heat uptake (Argo) appears inconsistent with such a high ratio.
Steve,
I realise it’s plausible, but it’s not obvious that it is necessarily the case. We have climate models with TCR values close to 2K that reasonably match the historical temperature record, so it’s not clear that we should assume that the emperically determined TCR is slightly higher than the true TCR.
If the TCR-to-ECS ratio is around 0.7 (rather than 0.6) that would suggest that the final warming would be around 85% of the transient response when we halted emissions.
“I realise it’s plausible, but it’s not obvious that it is necessarily the case.”
Can we at least agree that a slower than 1% increase (<0.0523 watt/M^2 per year) wouldn't produce FASTER warming than a 1% per year increase? I honestly don't see how a slower rate of increase in forcing can yield an equal rate of warming.
Steve,
I’m not sure why we specifically need to agree. I can see the point that you’re making but I don’t have a feel for what sort of difference one would expect.
Steve,
I found this. Figure 10 shows a comparison between 1% per year simulation and RCP scenarios. It looks like it is about a 10% effect.
This Isaac Held post seems to do exactly as we’re discussing. It seems to be suggesting that for a 70 year ramp up, the difference might be small.
A 10% difference between empirically determined ‘pseudo-TCR’ and true TCR seems plausible. That would put the empirically estimated TCR/ESC ratio (again, from my post at Lucia’s) at about 0.65.
Victor,
Instead of pouring vodka in the Kool-Aid, try Bingo instead. On the new definition of academic misconduct thread, I’m just an #AlGoreIsFat away from the win.
Anders,
I have a novel idea: let’s reduce net emissions to zero and find out.
Brandon G.
So we need 25 terms, right?
I’ll take yours and contribute 5 more.
1. AlGoreisfat
2. But, RealClimate moderation.
3. Lysenko!
4. Upside down Tiljander
5. Alarmists!
6. Trace Gas!
Joshua, a new one in my experience:
7. Most species that ever existed were already extinct before we got here.
Can be get anyone for:
8. Most planets that ever existed were already destroyed before we got here?
Turbulent Eddie:
Hmm, according to data collected by the Global Greenhouse Gas Reference Network, global atmospheric CO2 is now 8ppm greater than it was five years ago, and has shown no sign of leveling off. Indeed, from Tamino’s latest post it appears the rate of increase is accelerating. TE, I suppose you have a source that convincingly contradicts the GGGRN data?
TE and reading never really go hand in hand. [Mod: Let’s keep it pleasant.]
Here’s his link;
https://www.iea.org/newsroomandevents/pressreleases/2016/march/decoupling-of-global-emissions-and-economic-growth-confirmed.html
Quoting the first sentence of his link which he didn’t read;
“Global energy-related carbon dioxide emissions (CO2) – the largest source of man-made greenhouse gas emissions – stayed flat for the second year in a row, according to analysis of preliminary data for 2015 released today by the International Energy Agency (IEA).”
So self reported data on CO2 emissions from power plants are flat. OK.. China has an economic downturn… That would do it…
http://www.theaustralian.com.au/business/business-spectator/how-china-is-adding-one-idle-coal-plant-every-week/news-story/a53b5bf16202ca60a9bb01f12e64ccac
Victor –
Suspect it’s not actually true. Most stars are only at the start of their lives..
It is true that most species that have ever existed have gone extinct, and that even if humans wiped themselves out nuclear-style next Tuesday, the biosphere would regenerate an analogous set of species to the pre-human set within just a few million years. Problem is for humans, I’m not sure that taking the kids to the Zoo in 2100 will be much fun. Cockroach petting, anyone?
Andrew, surely more planets and stars have died in the long period before man existed than the short period since we existed? Same for species. (And those mitigation sceptics were supposed to have a feeling for geological time, which is why they know deep in their hearts that nothing short term can happen.)
Most stars are only at the start of their lives.
If that were true, I think I would still be right, see above, but I am not sure this is right. Short Wikipedia hunt for numbers: Our sun is only 4.6 billion years old, in 5 billion years it will expands and destroy some planets in the process. The universe is 13.799 ± 0.021 billion years old; shortly after (100 million years) first stars were created. At least one star died before ours was created, that is where our metals come from.
Physics, do you have an estimate on the planet/star part? Is our sun exceptionally young and short lived?
Victor, , so if the Sun has a lifetime of ~ 10 Gyr, a 10 Solar mass star will have a lifetime of only about 10 Myr, and no stars less about 80% that of the Sun have ever died. Most stars that are born have masses less than the Sun, and so I don’t think it’s true that most planets that have existed have already been destroyed.
Stellar lifetimes go something like
There is this though, which is suggesting a white dwarf (what the Sun will eventually become) consuming a planet. It also might show evidence for Calcium Carbonate.
so I don’t think it’s true that most planets that have existed have already been destroyed.
Interesting, so that part of Andrew’s statement was right.
But I originally only claimed more planets were destroyed before man appeared than in the minuscule period after.
Okay, yes, that may be true, given that we’ve only been here around 200000 years.
Leave it to the astronomer to be the wet blanket, Victor, sheesh. 🙂 I cruised by WUWT last night and picked up another one:
8. Hansen’s boiling oceans.
Context was, OHC in some smallish grid of the N. Atlantic is showing cooling down to 700 m. I posted the global OHC plot to the same depth showing unabated warming. I paraphrase the response: Yabbut, we’re a long way from Hansen’s boiling oceans, stop wetting your pants over miniscule changes. I replied that GMST has changed at four times the rate over the same interval, which is a conservative estimate … over the ice age cycles the ratio is more on the order of six to one, with a lag of a few thousand years. [1]
Bit of a rant there, but I think somewhat appropriate to the original topic of committed warming.
———————
[1] Based on my interpretation of the data from Bintanja et al. (2008).
Brandon –
Would
“Hansen predicted NYC would be 10 feet below water by now.”
Be too similar to your #8 to get it’s own square?
But CAGW.
Joshua,
If we put our minds to it, we could probably come up with 25 “but Hansens”, so sure make that the ninth. Willard gets my nomination for #10.
11. It’s still snowing in the UK (or anywhere).
12. But Antarctic sea ice. (Bonus points if the ocean qualifier goes missed.)
Brandon –
==> If we put our minds to it, we could probably come up with 25 “but Hansens”,
Yeah. I had exactly the same thought.
I’ll also note, we could have filled out a card just from Ron’s comments alone in that previous thread.
Speaking of which:
13. CO2 lags temperatures.
> CO2 lags temperatures.
That’s #12 over there:
https://www.skepticalscience.com/co2-lags-temperature.htm
Reorganizing these arguments would be nice.
How about, simply, “But, Obummer?”
It isn’t directly related to climate, but it is one of the most common arguments.
And, of course, “But, denier,” which should probably be worth two squares or some kind of a wild card.
http://neverendingaudit.tumblr.com/tagged/YesButDenier
Hyperactive Hydrologist says: June 15, 2016 at 4:44 pm
“”Higher temperature could also cause die off of the Amazon rain forest with an estimated 20-40% for 2oC and up to 85% for 4oC. This is another potential source of CO2 as well as reducing the biospheres ability to remove CO2 from the atmosphere.
Assuming the natural world will adapt is a bit short sighted as the basis of a lot of ecosystems, trees, have a limited ability to migrate to cooler climates.””
–
Look at both sides of the coin.
Perhaps, since the temperate world just south/north of the tropics has now become 2 to 4 C warmer, ie tropical, the Amazon rain forests could just migrate to the now new tropical zones?
“”I also wonder what impact the recent forest fires have in Indonesia have had on CO2 emissions and whether these have been included in the global emission estimates for 2015″”.
–
Forest fires, while having an unfortunate tendency to being exacerbated by human activity, also occur naturally and more so in drought [El Nino for this area conditions].
Millions of years of forest growth and decay means there is always a natural turnover of CO2.
What did not burn in a non fire year did not stay there it went back into the air in the form of other forms of decomposition [not fire]. What did burn up this year means less CO2 next year.
This principal is used in burn backs in fire prone Australia and would be very useful if extended to California and Spain.
brandonrgates says: June 16, 2016 at 2:40 am
“”7. Most species that ever existed were already extinct before we got here.””
non sequitur – More people are alive today than have ever died.
–
Victor Venema says: June 16, 2016 at 12:29 pm
8. Most planets that ever existed were already destroyed before we got here?
Andrew Dodds says: Suspect it’s not actually true. Most stars are only at the start of their lives..
..and Then There’s Physics says:
Stellar lifetimes go something like M^{-3}, so if the Sun has a lifetime of ~ 10 Gyr, a 10 Solar mass star will have a lifetime of only about 10 Myr, and no stars less about 80% that of the Sun have ever died. Most stars that are born have masses less than the Sun, and so I don’t think it’s true that most planets that have existed have already been destroyed.
–
I thought we were made from bits of previous suns that had existed and imploded, presumably they had planets around them as well??? which were destroyed as per Victor.
Age of Universe as we know it 14 Billion years,
Stars that are left, nonimploded were always small but there may have been many times more bigger suns that we know do not know of that have exploded over that time, All the really big ones actually.
A bit like that looking at the bombers that made it back type problem.
So, I thought that the sun was an insignificant small sun that was expected to explode in say 4 billion years time.In a universe of bigger suns, not a run of the mill we are all smaller suns universe.
ATTP more insight please? Very interested.
Joshua says: June 16, 2016 at 9:06 pm Brandon –==>
If we put our minds to it, we could probably come up with 25 “but Hansens”,
– Try Real Climate Responses to common contrarian arguments: 42 “”but Hansens”” in their old section so you can rest your minds and just list them
14. CO2 is plant food. [Surely this was already on the list?]
alternate 14. New and improved air! It’s got what plants crave!
15. Think of the poor, you heartless socialists.
16. It’s all about the big juicy grants.
> More people are alive today than have ever died.
http://www.scientificamerican.com/article/fact-or-fiction-living-outnumber-dead/
angech,
Yes, but we do think that we know the initial mass function for stars. Stars that explode (go supernova) and release heavy elements have masses above 8 Solar masses. For every star that forms with a mass above about 8 Solar masses, we expect there to be about 10 stars with masses between 2 and 8 Solar masses, 50 stars with masses between 0.5 and 2 Solar masses, and 200 stars with masses between 0.1 and 0.5 Solar masses (anything with a mass below about 0.1 Solar masses is a brown dwarf, not a star). So, we have some sense of how many massive stars have probably formed and in terms of number of stars, the lower mass stars dominant.
A few things to bear in mind. The single massive star could have a mass of 100 Solar masses and so might have a mass similar to the total of all the lower mass stars I mentioned above (10 x 5 + 50 x 1 + 200 x 0.25 = 150). In terms of luminosity, it could outshine all the others stars that I mentioned. So although the number of very high mass stars that form is low relative to the number of low-mass stars that form, they’re important both in terms of the material they can recycle and how much energy they release.
The most massive star that we think can form is around 150 Solar masses (otherwise its own radiation pressure would blow it apart) and the lowest mass a star can have is about 0.08 Solar masses (less than this and the core doesn’t become how enough for nuclear fusion and it becomes a brown dwarf), so the Sun is relatively low-mass but not the lowest. It’s got a total lifetime of around 10 billion years, at which time it will expand to become a red giant (radius will increase by about a factor of 100 and it will become about 10000 times more luminous). It will eventually start burning helium in its core and contract again, but will quickly run out of helium again and start expanding again. The outer layers will get blown off and form a planetary nebula and the core will remain as white dwarf (mainly carbon, mass about 1/3 that of the Sun today, radius about the same as the Earth).
angech wrote “Look at both sides of the coin.
Perhaps, since the temperate world just south/north of the tropics has now become 2 to 4 C warmer, ie tropical, the Amazon rain forests could just migrate to the now new tropical zones?
I very much doubt that – Hadley Cell; this was mentioned in our previous discussion of the hydrological cycle, which oddly enough is quite important for rain forests.
If you think that someone isn’t looking at both sides, then it is possible that they actually have done so, but that they know more than you do. This means that there may be a problem with your counter argument that you ought to look for before deploying it.
…or at least deploy it as a question, rather than as an accusation of bias or lack of research.
Hmmm.
Both VictorVenema (June 15, at 12.38) and CliveBest (June 15, at 1.01) seemed to make reference to AR5 (Victor said ‘last IPCC report’ , CliveBest explicitly so to AR5 WG1 p 213) but am I correct that they actually made reference to AR4? (I got a bit frustrated as I could not find their quotes in AR5)
Am I correct that this subject is dealt with in AR5, WGI, Chapter 12, par 12.5 – 12.5.4 (p.1102-1114) and FAQ 12.3 (p.1106-1107) and that the conclusion is not different from AR4.
My understanding from that is, that the cumulatieve quantity of emitted GHG is defining the total warming (on human or policy-relevant timescales of say, one or two centuries), implying that GHG-emissions have to practically be zero in order to ‘freeze’ further global warming.
If that understanding is correct, I would really appreciate an answer to the following question.
Assuming that we continue to emit at our present annual emission-rate, how many years will it take to get to (reaching our carbon budget for) 2C? And how many years to get to (reaching our carbon budget for) 1,5C? Any references to IPCC or other scientific (or generally accepted/undisputed) literature?
jac.
jac.
If you look at Chapter 12, page 1033, it discusses the Transient Response to Cumulative Carbon Emissions (TCRE) which has a value of between 0.8 and 2.5oC per 1000PgC (or per 1000 GtC – 1PgC = 1GtC). If you take the middle as the best estimate then it would be about 1.7oC per 1000GtC. Since we’ve warmed by about 1oC after emitting around 600GtC, this looks about right.
If so, if we want to keep below 1.5oC, we should emit no more than a total of 880GtC, so about 280GtC more than we have to date. At current rates (10GtC/yr) that’s 28 years. To stay below 2oC, we can emit no more than a total of about 1200GtC, so no more than 600GtC than we have to date, so another 60 years.
Of course, these would give us a roughly 50:50 chance of staying below these level of warmings. If you want a higher chance you would need to emit less. For example, that same page in Chapter 12, says to stay below 2oC, we should not emit more than a total of 1000GtC, so 400GtC more than we have to date, and so 40 years. Since the TCRE is linear with emissions and we’ve warmed by about 1oC to date, that would give a carbon budget for 1.5oC of about 200GtC, or another 20 years.
This Carbon Brief article is even more conservative and says 5 years before we blow the 1.5oC, and 20 years before we blow the 2oC budget, but that’s for 66% chances. Not quite sure why it is so different, but I’ll try to work that out.
Dikran Marsupial says:
“I very much doubt that – Hadley Cell; this was mentioned in our previous discussion of the hydrological cycle, which oddly enough is quite important for rain forests.”
–
Perhaps the Hadley cells are temperature dependent as well and would also move the rain to the new right spot. If not the extra heat would not seem to be a factor to me having seen the Cambodian temples with temps of 38 degrees in the early morning and temples covered under luxuriant growth which seemed to love, not hate the heat.
As I recall there is a tree line which exists because plants do not like cold.
The hot deserts however only lack trees due to Hadley cell effects as you rightly say.
Water plus heat equals plant growth or have I missed something?
Magma helps not, [ 14.]
ATTP thanks for the extra info on the stars and their formation
and Willard and Wiki thanks.
I did not realize it was false.
angech wrote “Perhaps the Hadley cells are temperature dependent as well”
Did you try reading the Wikipedia page? Obviously not. Have you read this article? If not, you should, you really are not creating a good impression. In scientific discussion it is generally a good idea to actually follow up the links that are provided and not throw out counterarguments without trying to determine if they have some validity first.
ATTP
Thank you. I seemed to recall I had read about the 5 year for 1,5C and 20 years for 2C but could not retrace or find it and the reason to try and find it (and asking here) was indeed wondering about the differences. Thank you for your time.
jan.
jac,
I’m still not sure of the difference. From the table in that Carbon brief article, it looks that the TCRE that is being used is around 2.5oC per 1000 PgC, which seems a bit high. Reading the text, it might be that they’re also considering the emission of other greenhouse gases. My understanding, though, is that those typically decay reasonably quickly and so the dominant effect is the CO2, but I’m not really sure.
jac., yes I was referring to AR4, also gave a link to it. It is not my topic, bit knew about this FAQ. Would be curious if anyone knowledgeable would know whether our understanding has changed.
Click to access ar4-wg1-chapter10.pdf
Committed future warming exists independent of present and future atmospheric forcing, in the more or less stable components of the anthropogene albedo footprint.
It may take millennia for low albedo materials like asphalt paving to decay or be buried deep enough in the ever-evolving geological column to no longer figure in radiative forcing.
Thus far , about half of the land surface of the earth has been perturbed by still-visible human use.
It will take more than white urban roofs to undo this.
Joshua,
Indeed. King Hussein Osama is so good that he retroactively causes financial disaster:
I told him Tom Karl would have my nomination for president for the retroactive fix. What number are we on? After Magma’s three contributions, looks like Karlized SSTs are #17. Here’s another:
18. Climastrologists are afraid to debate climate realists.
19 is your “but den!er”, bonus square of your choice when accompanied with a gripe about non-existent associations to historical revisionism (in the disparaging sense).
Brandon –
I think we’re up to 19.
So, then my suggestion for, 19: Chaos!
I think we could go with “But, John Cook” for 20-21.
Not sure how we get an official ruling on the terms
————————–
angech –
==> – Try Real Climate Responses…
Thanks for that. You reminded me of one of the all time most common.
22? They did it first/do it too!
angech,
That many? It’s a tad distressing it’s smaller than the number of excuses for The Great Milennial Pause — but hey, at least Douglas Adams would approve of the exact number. Besides, “boiling oceans” gives all new meaning to “so long and thanks for all the fish”.
I think copypasta in this context would constitute cheating. Certainly not as much of a light diversion.
Joshua,
Darn you, I shoulda gotten “but chaos” … I was even thinking about it yesterday. You know how Trivial Pursuits has different editions, yeah? All the “But Person X” arguments get their own board. If Willard will be reasonable about the royalties, we could call it Celebrity ClimateBall™ Bingo.
25. These so-called “scientists” don’t know nuffin’. They cannot even count.
The same thing happens in W.
But X. What about Y? No one says Z. Yes, you think A. Do you think B helps?
You started it. You made me do it. You don’t keep an open mind.
Science is not about authority. Many Nobel laureates agree with me.
***
It would be interesting to validate using tropes from another scientific discourse.
You can’t make this up:
http://briandeer.com/solved/david-lewis-1.htm
[1]: Gremlins
[2]: Groupthink
[3]: Chewbacca
==> It would be interesting to validate using tropes from another scientific discourse.”
It’s very interesting how many parallels there are in form between climate “skepticism” and anti-vaxerism. Also interesting is how all but one denizen ignored Denizen Don. That’s a shame, because I’d love to see how would they argue against Denizen Don, if not through what they would consider an appeal to authority should it be used in the domain of climate science (and thus, tunneling holes into the very foundation of their climate “skepticism)? The one response that he got from a denizen was an appeal to self-authority from Rud, and of course, appeal to self-authority is the Cliffs Notes for every comment that Rud writes, so you can’t judge much from that.
Let Victor’s 25 stay at 25. (Maybe he homogenized it… 🙂
23. If alarmists genuinely wanted to convince realists about CAGW, they’d be more polite.
After thinking about it I prefer the alternate version of 14.
14. New and improved air. It’s got what plants crave.
For reference see the satirical film Idiocracy. This scene with the U.S. Cabinet five hundred years from now reminds me of arguing with climate skeptics — https://www.youtube.com/watch?v=3boy_tLWeqA
And a funny exchange between the now two smartest people in the world, selected for a suspended animation experiment gone wrong because they were utterly average and dispensable.
How did the world ever get like this?
You think Einstein walked around thinking everyone was a bunch of dumb sh*ts?
Ahh… I hadn’t thought of that.
Now you know why he built that bomb.
@jac
Yes – sorry the reference to the BERN model was indeed from AR4 !
To see why the A0 term cannot be constant we need only look at the PETM event when a natural ‘burp’ of CO2 equal to burning all known reserves of fossil fuels occurred 55 million years ago.
Clive
Clive,
I don’t think anyone has suggested that it is actually constant. Even your own figure shows that the recovery time is ~100000 years.
Yes, that’s an odd thing to reference. I use the PETM as a fine example of the long term persistence of CO2 after a (geologically) abrupt large-scale release.
brandonrgates says: June 17, 2016 at 9:52 pm angech,
–
“Try Real Climate Responses to common contrarian arguments: 42 “”but Hansens”” in their old section so you can rest your minds and just list them.
That many? It’s a tad distressing it’s smaller than the number of excuses for The Great Milennial Pause — but hey, at least Douglas Adams would approve of the exact number.”
–
a little known fact is that the answer was wrong
–
” Answer to the Ultimate Question of Life, the Universe, and Everything”, The number 42 calculated by an enormous supercomputer named Deep Thought over a period of 7.5 million years. Unfortunately, no one knows what the question is. Thus, to calculate the Ultimate Question, a special computer the size of a small planet was built from organic components and named “Earth”. The Ultimate Question “What do you get when you multiply six by nine?” was found by Arthur Dent in the second book of the series, “The restaurant at the end of the Universe “.
Dikran Marsupial says: June 17, 2016 at 12:52 pm
“angech wrote “Perhaps the Hadley cells are temperature dependent as well”
Did you try reading the Wikipedia page? Obviously not. If not, you should, you really are not creating a good impression. In scientific discussion it is generally a good idea to actually follow up the links that are provided and not throw out counterarguments without trying to determine if they have some validity first.”
–
From Wikipedia, since someone has not read it [not this little bunny].
–
“Those models show that the Hadley cell will expand with increased global mean temperature (perhaps by 2 degrees latitude over the 21st century]”
–
Also
“This might lead to large changes in precipitation in the latitudes at the edge of the cells”
–
supporting my theme that the tropical zones would migrate pole-wards with increasing temperature and the Hadley cells which are temperature dependent, Dikran, would supply more rain to these areas.
It would appear the argument has validity by the link provided, thanks.
What is the confidence (and its source) in the 5.35 Watts in the deltaFinit equation? I have run MODTRAN and for clear skies it shows a value of 4.7 Watts, and for a sky with clouds then it drops to 3.7 Watts. Most of the earth has some sort of cloud cover, so it seems like the 5.35 Watts value may be 30% too high. MODTRAN has been extensively validated by the US Air Force, so I think confidence in its numbers are pretty high.
TonyL,
The 5.35 gives a change in forcing of 3.7 W/m^2 for a doubling of CO2, which sounds consistent with what you found. Remember, it’s 5.35 ln(2).
angech ““Those models show that the Hadley cell will expand with increased global mean temperature (perhaps by 2 degrees latitude over the 21st century]””
Does this mean you consider climate models reliable sources of evidence?
BTW if there was any doubt that angech’s approach to science, there is always the fact that he only cited the information from the Wikipedia page that supported his argument (and only after I had pointed him in the right direction), but he somehow failed to mention the bits that didn’t:
“As the areas around 30 degrees latitude become drier, those inhabiting that region will see less rainfall than traditionally expected, which could cause difficulty with food supplies and livability.[6] There is strong evidence of paleoclimate climate change in central Africa’s rain forest in c. 850 B.C.[7] Palynological (fossil pollen) evidence shows a drastic change in rain forest biome to that of open savannah as a consequence of wide-scale drying not connected necessarily to intermittent drought but perhaps to gradual warming. “
Dikran Marsupial says:
“Does this mean you consider climate models reliable sources of evidence?”.
An interesting question which has been raised many times here and elsewhere.
1. A model is not a source of evidence.
You will argue this as well on the definition of “source” and “evidence” so I will state that evidence is a provable fact or observation and that a source is an original not a model for my statement such as it is.
A climate model or any other model is a good way of investigating or demonstrating a theory or concept. They are only as good as their input.
The Hadley cell principle can be modeled but it in no way depends on a model to prove it.
Climate models with good inputs such as tidal heights and short term weather forecasts are reliable sources of outcome, not evidence.
Reliable yes, evidence no.
angech wrote “The Hadley cell principle can be modeled but it in no way depends on a model to prove it.”
The only evidence of the expansion of the Hadley cells is that the models predict it, at least the only evidence provided so far. Note you wrote
“Those models show that the Hadley cell will expand with increased global mean temperature (perhaps by 2 degrees latitude over the 21st century]”
It is the only evidence you have provided.
It is a shame that attempts to discuss science so often end up in this sort of pedantry (incorrect in this case) and evasion.
I think PETM shows the worst that could happen if we continue burning all fossil fuels until they all run out. The global average temperature rose about 5C.
Dikran Marsupial says:
“BTW if there was any doubt that angech’s approach to science, there is always the fact that he only cited the information from the Wikipedia page that supported his argument.”
Thank you for admitting that there was evidence on the Wiki page supporting my argument.
“he only cited the information from the Wikipedia page that supported his argument.”
Really?
Your point being?
I am not allowed to cite supporting evidence for an argument?
–
Your remark that “he somehow failed to mention the bits that didn’t:” suffers from the same problem, as well as not being correct.
I was talking about the tropics , remember?
If deserts at 30 latitude which already exist get dryer that has nothing to do with my argument about the tropics and the expansion of the Hadley cells with temperature increase.
[In fact the deserts would also shift further polewards by 2 degrees with large rainfalls at the edge].
The paleontology 850 BC pollen evidence of rain forest biome change said it could* [ that could word again, Brandon] be due to drought or warming and did not give an explanation as to why in 850 BC the Hadley cells would suddenly be affected to cause such a change. No CO2 increase then but perhaps Dikran could explain the cause of the Hadley cell change at that specific time, if such a change in Hadley cells [not forests] did occur?
And if due to warming the cause of the warming?
angech “Your point being? I am not allowed to cite supporting evidence for an argument?”
It’s called “confirmation bias”, sure cite the evidence that supports your argument, but also acknowledge the evidence that doesn’t.
“I was talking about the tropics , remember? If deserts at 30 latitude which already exist get dryer that has nothing to do with my argument about the tropics and the expansion of the Hadley cells with temperature increase.”
where do you think Hadley cells currently descend? If they expand, where do you think that expansion will be? Its almost as if you didn’t bother reading the Wikipedia page ;o)
Clive
1. What is the uncertainty on the 5C figure?
2. What is different about the current climate state compared to that at the start of the PETM?
3. Taking these into account, revise your worst case figure.
Grown ups want to know the answers.
On the PETM, an oldish review from realclimate and a newer one from skeptical science.
http://www.realclimate.org/index.php/archives/2009/08/petm-weirdness/
http://www.skepticalscience.com/the-perplexing-PETM.html
Compare and contrast content with Clive’s statement.
Others may have
@-angech Re;-42
“a little known fact is that the answer was wrong”
While other better qualified can correct your scientific errors, I can only point out your literary misapprehension.
@-“” Answer to the Ultimate Question of Life, the Universe, and Everything”, The number 42 calculated by an enormous supercomputer named Deep Thought over a period of 7.5 million years.”
Yes, Deep Thought gets the right answer.
@-“Thus, to calculate the Ultimate Question, a special computer the size of a small planet was built from organic components and named “Earth”. The Ultimate Question “What do you get when you multiply six by nine?” was found by Arthur Dent in the second book of the series,”
However that was after the telephone sanitisers and other Golgafrichans from the B-Ark had crashed on Earth and disrupted the program. Not least by adopting the leaf as the unit of currency and using forest burning as a currency revaluation method…
It is possible D.A. was implying something about how our use of resources as if we were visiting aliens has crashed the Earth computer.
Clive Best
Actually, given that the Palaeocene was a high CO2 world, the release during the PETM may have only been about a doubling. You might want to consider the implications of this for your argument.
angech
The downward extratropical circulation of the Hadley Cell is composed of hot, dry air. The land on which it falls is consequently arid or desertified. If the Hadley Cells expand, the arid belts will move polewards, which may impact the temperate midlatitudes where the majority of the world’s arable productivity lies.
Riffling back through my notes on expansion of Hadley Cells (I have not re-checked the links so there might be the odd dud):
Tropical storms migrate towards poles (BBC)
http://www.bbc.co.uk/news/science-environment-27408964
Lucas et al. (2013) The expanding tropics: a critical assessment of the observational and modelling studies
http://onlinelibrary.wiley.com/doi/10.1002/wcc.251/abstract
Zhou et al. (2011) Recent trends of the tropical hydrological cycle inferred from Global Precipitation Climatology Project and International Satellite Cloud Climatology Project data (supports J&F09 on widening Hadley cells – see below)
http://onlinelibrary.wiley.com/doi/10.1029/2010JD015197/abstract
Johanson & Fu (2009) Hadley Cell Widening: Model Simulations versus Observations
http://journals.ametsoc.org/doi/abs/10.1175/2008JCLI2620.1
See also NOAA (Seidel et al. 2007 – Fu was a co-author)
http://www.noaanews.noaa.gov/stories2007/20071203_tropicalbelt.html
Correction:
“
IfAs the Hadley Cells expand, the arid belts will move polewards,”izen says: June 18, 2016 at 3:42 pm
“While other[s] better qualified can correct your scientific errors, I can only point out your literary misapprehension.”
@-“” Answer to the Ultimate Question of Life, the Universe, and Everything”, The number 42 calculated by an enormous supercomputer named Deep Thought over a period of 7.5 million years.”
The Ultimate Question “What do you get when you multiply six by nine?” was found by Arthur Dent in the second book of the series,”
–
Thank you Izen. No misapprehension there then.
Thanks for pointing it out would have been a nice comment.
–
“It is possible D.A. was implying something about how our use of resources as if we were visiting aliens has crashed the Earth computer?”
–
I think D.A. was having a go at all those people who take the question of life too seriously.
–
two small points.
You forgot to mention.
The telephone sanitizers played an important role on their home planet and it wrecked their civilization when well intentioned folk took drastic action to remove what they saw as their CO2 problem [stupidity].
.Little did they realize that stupidity was an essential part of their society’s fabric.
–
The book emphasizes the interconnectivity of everything, every action has a consequence and we do not know what the consequences of our actions will be, other than they will not always be what we expect and hope for. I could suggest for others to read Hamlet for help with understanding literary misapprehension and the meaning of life.
.
BBD says: June 18, 2016 at 6:50 pm
“The downward extratropical circulation of the Hadley Cell is composed of hot, dry air.”
–
Thank you for your support and agreement in this important matter BBD.
AS you point out the extratropical component that Dikran goes on about is hot dry air.
Where as you and I are discussing the effect of Hadley Cells on tropical zones which come from the precipitation caused by the upgoing humid air before 30 degrees latitude
–
Tropical storms migrate towards poles (BBC)
Lucas et al. (2013) The expanding tropics: a critical assessment of the observational and modelling studies
Zhou et al. (2011) (supports J&F09 on widening Hadley cells – see below)
NOAA http://www.noaanews.noaa.gov/stories2007/20071203_tropicalbelt.html
–
Your references to the tropical effects of Hadley Cells and how this rainfall will go further North and South as the Hadley Cells expand is the very thing I was trying to bring to Dikran’s attention.
–
Dikran Marsupial says: June 18, 2016
“where do you think Hadley cells currently descend?”
I was talking about the tropics , remember? where they ascend and go over.
why are you changing the topic?
Never mind you want to talk about deserts, not expanding tropics which is the discussion at hand.
“”If they expand, where do you think that expansion will be?””
Where they ascend and go over when I am talking about the tropics.
Look at BBD’s reference headlines above.
angech
Well, no, we’re not.
You say:
As I understand it, the effect of AGW on the Hadley Cells is to increase precipitation in the tropics, not move it polewards.
ATTP, my apologies for not writing clearly. I am still questioning the 5.35 W/m^2 value (I’ll call it alpha) in your first equation.
When I run MODTRAN with a clear sky for a tropical atmosphere at 280 ppm CO2, I get an upward IR flux of 290.952 W/m^2. Then for 560 ppm CO2 I get 287.718 W/m^2. The difference is 3.234 W/m^2. Divide this by ln(2) and I compute alpha as 4.66 W/m^2.
When I change from clear sky to cumulus clouds, the IR flux is 263.352 W/m^2 at 280 ppm CO2. Then for 560 ppm CO2 the IR flux is 260.777 W/m2. The difference is 2.575 W/m^2. Divide this by ln(2) and alpha is 3.71 W/m^2.
I’ve run other values for mid-latitude summer models and get similar net results.
Since most of the sky has some clouds, I would think that alpha would be closer to the 3.71 W/m^2 value, and certainly below the 4.66 W/m^2 value. I am curious where the 5.35 W/m^2 value comes from and how it was computed.
BBD says:June 18, 2016 at 11:47 pm
“As I understand it, the effect of AGW on the Hadley Cells is to increase precipitation in the tropics, not move it polewards.”
–
Wiki. states that it moves polewards,
“” Those models show that the Hadley cell will expand with increased global mean temperature (perhaps by 2 degrees latitude over the 21st century [5]”
A the Hadley cell starts at the equator expansion from AGW will push it 2 degrees latitude polewards.
As well as increasing precipitation.
“the intertropical convergence zone, or ITCZ of the Hadley Cell develops a band of thunderstorms that produce high-precipitation.”
–
Your references, not mine, and thanks for providing them were
“Tropical storms migrate towards poles (BBC)
Lucas et al. (2013) The expanding tropics: a critical assessment of the observational and modelling studies
Zhou et al. (2011) (supports J&F09 on widening Hadley cells – see below)
NOAA http://www.noaanews.noaa.gov/stories2007/20071203_tropicalbelt.html”
All seem to be discussing the effect of Hadley Cells on tropical zones,
even if you choose now to say you are not.
@-angtech
“Wiki. states that it moves polewards,
“” Those models show that the Hadley cell will expand with increased global mean temperature (perhaps by 2 degrees latitude over the 21st century [5]”
A the Hadley cell starts at the equator expansion from AGW will push it 2 degrees latitude polewards.
As well as increasing precipitation.
“the intertropical convergence zone, or ITCZ of the Hadley Cell develops a band of thunderstorms that produce high-precipitation.”
Even I can spot your error here.
Yes, the Hadley cells expand as the climate warms, that means they arc over a larger area before descending, a larger area of aridity.
The rainfall occurs at the ITCZ which is constrained by the Sun position, it is a narrow band that lies under the solar zenith and therefore moves with the seasons. Warmer temperature will not change the position of the ITCZ, although they may increase the rainfall within it.
Expansion of the Hadley cells alters the climate where they descend widening the arid zone beneath them, but has little effect on the position of the ITCZ. That remains at the thermal equator. The luxuriant growth at the Cambodian temples will remain, the ITCZ will not shift polewards and starve them of rain. However the central region of China further north with low rainfall may expand.
angech wrote “Where as you and I are discussing the effect of Hadley Cells on tropical zones which come from the precipitation caused by the upgoing humid air before 30 degrees latitude”
angech is being disingenuous here, lets go back to the start of this discussion:
angech wrote “Look at both sides of the coin.Perhaps, since the temperate world just south/north of the tropics has now become 2 to 4 C warmer, ie tropical, the Amazon rain forests could just migrate to the now new tropical zones?”
This new tropical zone would have to be to the south of where the Amazon currently extends, hence the relevance of where Hadley cells descend (their effects don’t start sharply at 30 south), just as the rising of the Hadley cells doesn’t cause additional rainfall only at the equator. Additional rainfall in the existing tropics is not going to help expansion of the Amazon into angech’s “new tropical zones” in the south.
The funny thing is that the problems the Amazon is likely to face under climate change is not the heat AFAICS, but the increase in drought risk. As I understand it the rain forest is a cause of much of the precipitation that falls on it due to transpiration, and the degredation of the Amazon has made it more susceptible to drought. I don’t think this is considered so much a risk as it used to be.
“However, dry-season rainfall is strongly influenced by the tropical Atlantic north-south SST
gradient; intensification of the gradient (warming of northern SSTs relative to the south) shifts
the Intertropical Convergence Zone northwards (interannual time scales) and strengthens the
Hadley Cell circulation (longer time scales), enhancing the duration and intensity of the dry
season in much of southern and eastern Amazonia (16), as occurred in 2005.”
however
“There is mounting evidence from artificial drought experiments (36), flux towers, and satellite remote sensing of forest greenness (37) that intact Amazonian forests are more resilient (although not invulnerable) to climatic drying than is currently represented in vegetation-climate models..”
Click to access Malhi08.pdf
Of course if the Amazon rainforest does collapse over the course of a century or so, that doesn’t give time for the forest to migrate south on that timescale anyway, which is I suspect was HyperactiveHyrdologists point.
BTW I suspect the Amazon couldn’t expand much to the South East anyway due to the Brazillian highlands, nor the South West due to the Andes, even if the precipitation allowed it.
Thanks for the discussion , Dikran.
BBD, Izen, Brandon et al.
Have to go and find stuff in GHCN to refute some erroneous claims by a lukewarmer.
At least you guys cite real stuff even if you view the consequences differently.
TonyL,
I don’t know off the top of my head. I was recently looking at a paper that listed the forcing from different models, and they certainly all weren’t giving 3.7W/m^2, but I can’t remember what paper it was. I doesn’t really change what I’m illustrating here, as it cancels.
Since we’re discussing Hadley cells, my understanding is that they depend the temperature (or the temperature gradients) an on the Coriolis effect (rotation of the Earth). The air from the equator rises, produces a low pressure into which air from higher latitudes flow, and the air from the equator then flows to higher latitudes at higher altitude. The Coriolis effect, however, deflects this air to produce these cells. Changing the temperature will therefore likely change the size of these cells.
My understanding is that Hadley cells are an emergent property and is seen as one test of GCMs (which are typically called Global Circulation Models). Also, you can take the same models and apply it to Jupiter (the Met Office’s UM has certainly been used for this) and you reproduce the structures in Jupiter’s atmosphere.
AR5 WG2 Summary for Policy makers page 14/15:
Click to access ar5_wgII_spm_en.pdf
“A large fraction of both terrestrial and freshwater species faces increased extinction risk under projected climate change during and beyond the 21st century, especially as climate change interacts with other stressors, such as habitat modification, over-exploitation, pollution, and invasive species (high confidence). Extinction risk is increased under all RCP scenarios, with risk increasing with both magnitude and rate of climate change. Many species will be unable to track suitable climates under mid- and high-range rates of climate change (i.e., RCP4.5, 6.0, and 8.5) during the 21st century (medium confidence).”
There is a table on page 15 which shows maximum speed that species can move per decade compared with the speed at which projected temperatures move. My original point is that trees will struggle to keep pace with climate change.
Also from AR5 WG2:
“There is a high risk that the large magnitudes and high rates of climate change associated with low-mitigation climate scenarios (RCP4.5 and higher) will result within this century in abrupt and irreversible regional-scale change in the composition, structure, and function of terrestrial and freshwater ecosystems, for example in the Amazon (low confidence) and Arctic (medium confidence), leading to substantial additional climate change. There are plausible mechanisms, supported by experimental evidence, observations, and model results, for the existence of ecosystem tipping points in both boreal-tundra Arctic systems and the rainforests of the Amazon basin. Continued climate change will transform the species composition, land cover, drainage, and permafrost extent of the boreal-tundra system, leading to decreased albedo and the release of GHGs (medium confidence). Adaptation measures will be unable to prevent substantial change in the boreal-Arctic system (high confidence). Climate change alone is not projected to lead to abrupt widespread loss of forest cover in the Amazon during this century a (medium confidence), but a projected increase in severe drought episodes, together with land use change and forest fire, would cause much of the Amazon forest to transform to less dense, drought- and fire-adapted ecosystems, and in doing so put a large stock of biodiversity at elevated risk, while decreasing net carbon uptake from the atmosphere (low confidence). Large reductions in deforestation, as well as wider application of effective wildfire management, lower the risk of abrupt change in the Amazon, as well as the impacts of that change (medium confidence).”
While the confidence in some of these projections are low we have to remember climate change is about risk management. I do risk assessment quite often in my job and if I identify a hazard that would cause serious injury or death, even if the risk was relatively low, I would not be able to proceed without mitigating the risk. For example working on a busy road the consequence of being hit by a car would likely be death or serious injury. Therefore the mitigation is to wear high viability clothing reducing the probability and consequences (drivers tend to slow down when they see workers in high vis clothing) to an acceptable level.
For me climate change should be treated in the same way. The impacts are potentially very severe therefore we should do everything possible to mitigate the risks. If you want to argue that the net benefits of climate change is positive you need to produce very high confidence if not certain evidence for this.
angech, acknowledges his goalpost shift in usual blog style – by walking away.
angech wrote “Have to go and find stuff in GHCN to refute some erroneous claims by a lukewarmer. At least you guys cite real stuff even if you view the consequences differently.”
Just a piece of advice, until you can cite “real stuff”, you are not in a position to refute erronous claims by anybody. As I pointed out earlier, if you think something is wrong, there is always the possibility that they understand the issue rather better than you do, and there may be a flaw in your refutation, so the onus is on you to find out whether your refutation is valid before you deploy it.
Last comment on Hadley cells, if the Hadley cells do expand by perhaps 2 degrees, it is reasonable to assume that half of this will be in the rising part at the equator and half at the descending part at about 30 degrees south. This implies that there is perhaps a 1 degree increase in the “rain band” that might be conducive to the growth of the rainforest. However this isn’t a great deal of additional land, and not all of that is useful (i) because of the high ground on either coast and (ii) because the additional area is next to the region of the Amazon that has the highest drought risk and therefore least equipped to expand. All AFAIUI, of course, but it seems there isn’t much value to angech’s objection to HHs claim.
angech
Sigh. This is what I said, and it is perfectly clear:
The only person moving the goalposts here is you.
ATTP,
I agree that the 5.35 W/m^2 value doesn’t change your results for the deltaTinit / deltaTfinal ratio since it cancels out. I was just curious of the source of the 5.35 W/m^2 value. I suspect it may be referenced in one of the IPCC reports, but those are so large it may be hard to find, especially if the equation is in an image (like your webpage). Nevertheless, if you stumble upon the source then perhaps you can email me something on the side.
I think the origin is here. I still can’t seem to remember the paper I was looking at recently that showed the forcing due to a doubling of CO2 for a sample of climate models. They all give slightly different results.
Now a different question about ECS estimation. Right up front, my question may be embarrassingly dumb, and if it is, please be gentle. 🙂 I have a background in computer science and physics, but not thermodynamics so much. I’ve taken some classes but it was 35 years ago and I’m rusty. Why does ECS take so long to achieve, especially when there are winter and summer cycles? I understand the thermal mass of the ocean is gigantic and adding ~3W/m^2 to the ocean would take a very long time to bring up the temperature. But during the first winter cycle when the ocean cools I would think the IR flux from CO2 would resist that cooling immediately and keep the ocean warmer than it would be without the CO2. Hence, it seems to me, that ECS might be very fast – perhaps 1 year. If it was that fast, then TCR would equal ECS and the ratio would be one. Anyone have any thoughts about this?
TonyL, , then eventually we have to equilibrate the whole system, including the deep ocean, and this takes a very long time, partly because it has a very large heat capacity, and partly because the energy transfer to the deep ocean is diffusive and hence slow.
It has to do with the deep ocean. The upper 50-100m is well mixed and so equilibrates with the surface/atmosphere quite quickly. It still takes a few years (4 years is a typical number), which is simply to do with its heat capacity. However, if we warm the planet some amount
Thanks for the link to the myhre_grl98 paper. It does show the 5.35 W/m^2 value for CO2, but this is 14% to 30% larger than what MODTRAN shows. I need to read the paper in more detail and perhaps try to follow some of the references. Thanks!
TonyL says: “When I run MODTRAN with a clear sky for a tropical atmosphere at 280 ppm CO2, I get an upward IR flux of 290.952 W/m^2. Then for 560 ppm CO2 I get 287.718 W/m^2. The difference is 3.234 W/m^2. Divide this by ln(2) and I compute alpha as 4.66 W/m^2.”
My emphasis. You should look at the downward IR flux. That is the additional energy flux available at the surface for warming and evaporation.
Victor,
I think Tony is doing the right thing; he’s considering how the outgoing flux varies with atmospheric CO2.
How the outgoing temperature varies with CO2 depends on the temperature change of the climate system. You need a climate model for that, not just a radiative transfer model.
Is that true if you just want to compute the change in forcing?
How is a radiative transfer model supposed to know how much the ocean will warm in response to the change in the atmospheric composition? That requires at least a surface model to split the additional incoming radiation up into a radiative upward flux, a heat flux and a humidity flux.
That is not a trivial task. Those people who are so happy with models with a low climate sensitivity, will find that those are also the models where the hydrological cycle is disrupted most. To do this well you also need a good model for the atmosphere, for example, to compute how fast the humidity in the boundary layer is transported (by convection) to the free atmosphere.
The downward IR flux is easy (ignoring feedbacks), that is just the atmospheric composition.
Indeed, but if all we want to know is how changing the atmospheric CO2 concentration will influence the planetary energy balance, then I think a radiative transfer model is all you need.
And a radiative transfer model can give a reasonably accurate number for the additional downward IR flux. That is the additional energy that is changing our climate. That is the number I would compare with climate models. All other fluxes may well be different for legitimate reasons. Thus I do not agree with TonyL that also the upward IR flux should fit between MODTRAN and a climate model.
Shellenberger goes with:
“Yes, but Robert Kennedy.”
combined with
“Yes, but antivaxers.
Hiya. In moderation 🙂
ATTP & Victor,
Thanks for the feedback.
I am very interested in looking at a radiative transfer model — do you have any recommendations for a good one that I can examine? I would love to look at source code, but if they also have some design documentation, then that would be excellent.
Tony,
Sorry, I don’t have any specific suggestions.
Victor says:
“And a radiative transfer model can give a reasonably accurate number for the additional downward IR flux.”
I would argue this is nonsense. For any height << one absorption length for IR photons to escape to space, there is no downward IR flux at all. Instead we have local thermodynamic equilibrium with upward and downward IR flux exactly equal. Convection drives heat up through the atmosphere to where it can freely radiate to space. Thermodynamics then sets the surface temperature.
Anthropogenic CO2 molecules radiating heat back down to earth is mythology.
ATTP,
Currently, aerosols offset approximately 50% of the total GHG radiative forcing. A significant reduction in GHG emissions will produce a rapid increase in the top of atmosphere radiative imbalance.
Additionally, there are specific feedbacks associated with the removal of aerosols. These feedbacks are 1) the natural water vapor and lapse rate feedbacks that are produced through atmospheric warming and 2) a direct impact of the removal of the aerosol-driven cooling mechanism, which has an effect of lowering the effective atmosphere height. Upon removal of this mechanism the tropopause height increases and a resultant lapse rate feedback works to amplify the current GHG radiative forcing value.
In addition to these feedbacks associated with aerosols, there are additional feedbacks that have been mesured directly through satellite analysis of the Arctic and the modeled response to GHG emissions. The first of these is the understanding that the loss of summer arctic sea ice has contributed 20% of the current global warming experienced, simply due to decreased albedo in the arctic summer.
When the summer sea ice is completely gone, there is an estimated total global warming impact that will be at least 40% of the current radiative forcing (from pre-industrial). This will occur due to the aerosol-driven feedbacks mentioned above and the fact that aerosols have about a 140% greater impact on the arctic than they do in the mid latitudes (increasing the lapse rate feedback by that much more in the arctic).
Finally, the lapse rate and water vapor feedbacks, making up the majority of radiative forcing produced by CO2 emissions is not instantaneous and Ricke & Caldeira (2014) showed that a single pulse of CO2 takes about 10 years to reach full warming potential.
Therefore, if we stopped all GHG emissions today, we would experience a total radiative forcing increase that is equivalent to approximately 300% of our current top of atmosphere radiative imbalance within the next 10 years (with the majority of that front-loaded in the next 2 due to aerosol reductions).
While additioanl CO2 would be removed by the earth’s atmosphere, possibly reducing it to 385ppm by 2025, it is very unclear what effect this warming pulse would have on natural carbon sequestration. There could be massive carbon releases due to regional warming in the arctic, permafrost disassociation, boral or tropic peat fire and forest fires or other sources that could work to rapidly reduce the natural uptake of CO2 from the earth’s atmosphere during this period.
With current globally averaged temperatures in 2016 looking to approach 1.4C above the pre-industrial level, I believe it should now be clear that the feedbacks outlined above (and more that have not been included!) prove that we have already surpassed a 2.5C earth’s equilibrium temperature threshold.
Recomended reading…
.Why Paris climate pledges need to overdeliver to keep warming to 2C, Guest Post by Dr Joeri Rogelj, Carbon Brief, June 29, 2016
Pingback: No, stabilising emissions will not stabilise concentrations! | …and Then There's Physics
Pingback: A bit more about carbon budgets | …and Then There's Physics
Pingback: A bit more about committed warming | …and Then There's Physics
@clivebest,
On the one hand, there’s a slam against an existing technology — harnessing solar energy whether directly or by wind — which has been deployed, even if not at sufficient scale, and on the other there is an appeal to a technology which no one knows how to do, let alone scale, let alone pay for, and let alone appreciate the consequences of it. Now that is what I call idol worship of as yet uninvented technology! It would be better to push clear air capture of CO2 as a yet undeveloped technology. At least that is known how to be done in principle, although no one has any idea on how to scale or pay for it.
I think the appeal to big, centralized energy is that this is the model which people have now and which present day developed economies know how to manage and make money from. However, they don’t seem to be enthusiastic about fusion as a future investment. Accordingly, given the present path, it’s just as plauslble to suggest some significant disruption of that developed economy and money-making. Since such a disruption has not been mapped out, it seems a tad presumptuous to declare this or that energy technology appropriate in such a future.
But everyone’s entitled to their own kind of highly wishful thinking, I suppose.
We do know how to do nuclear fusion. JET already produced 16MW of DT fusion power in 1997. It just has to be scaled up and made cost effective. Meanwhile regular fission works just fine.
The myth that Wind and Solar can somehow power the modern world is what I might call idol worship.
Clive,
I suspect that there is an enormous amount of complexity hidden in your just has to be scaled up and made cost effective. I have no problem with nuclear (fusion or fission) but I’m not convinced the former is quite as simple as you suggest, and the latter does have some problems of its own (mainly political/societal admittedly).
I worked on JET so I know how difficult it is.
Keep an eye on:
https://www.tokamakenergy.co.uk/
https://trialphaenergy.com/
+ others
@clivebest,
To the contrary, there isn’t even a pilot plant yet, just simulations, there are no safety standards, and they haven’t even settled on wall materials which can withstand the neutron bombardment. How can you possibly correctly claim it “just has to be scaled up”?
Fusion energy gain factor
https://en.wikipedia.org/wiki/Fusion_energy_gain_factor
“As of 2017, the record for Q is held by the JET reactor in the UK, at 0.67.
…
Using these values we find for a practical reactor Q = 22.”
Ha Ha Ha
Pingback: The two-degree delusion? | …and Then There's Physics
Pingback: Warming commitments | …and Then There's Physics